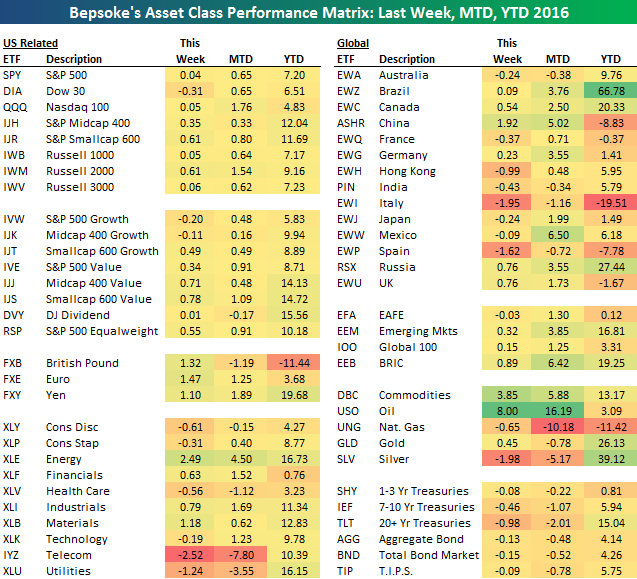
Below is an updated look at our asset class performance matrix using key ETFs traded on US exchanges. For each ETF, we show its performance this past week, month-to-date, and year-to-date. As one might be able to surmise, there really hasn’t been much in the way of major moves this month across the spectrum of our Asset Class Matrix. In fact, just eleven of the 58 ETFs shown are up or down more than 2%. Two of the biggest losers this month have been Telecom Services (-7.6%) and Utilities (-5.7%). These are generally considered ‘safe’ areas of the market, but ironically enough, have been some of the most volatile in a month lacking any volatility at all. On the upside, oil is up over 12%, and along with it, the Energy sector ETF is up just under 3%.
We analyze asset class performance, earnings season, economic indicators, sentiment and more in this week’s Bespoke Report newsletter. We also pack a ton of additional analysis into this week’s 30+ page report. You can read the entire thing by starting a 14-day free trial to our paid content below.
Have a great weekend!