Oct 27, 2017
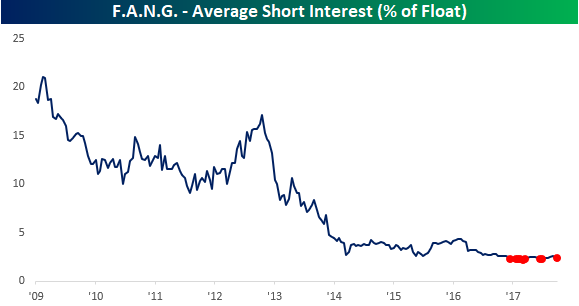
Here’s a cool chart from this week’s Bespoke Report. Short interest figures through the middle of October were released earlier this week and generally showed some modest increases following a major round of short covering in the second half of September. While there are any number of reasons why investors would be short a stock, it is usually a bet (or a hedge) that the price of the stock is going to go down. In looking at the short interest for individual stocks, we thought it was worth pointing out just how low short interest has become in the FANG stocks of Facebook, Amazon, Netflix and Alphabet.
Through the middle of October, the average short interest as a percentage of float (SIPF) in the four stocks was a minuscule 2.3%. While it is not uncommon to see some growth stocks have 10% or more of their float sold short, that isn’t the case with the FANG stocks. As recently as 2013, their average SIPF level was over 10%, and back in 2009 (before Facebook, when it was just “ANG”) the average SIPF level was above 20%! Click the button below to start a trial and read our popular Bespoke Report newsletter — released after the close every Friday.
Sep 29, 2017
With two new closing highs this week, and a total of nine in September, the new closing highs for the S&P 500 are really starting to pile up. Year to date, there have now been 39 closing highs, which puts the index on pace for 52 new closing highs on the year. The last time we saw more was in 2014, but before that you have to go back to 1995 when there were 77. In the index’s history, there have only been more than 50 closing all-time highs four other times (1961, 1964, 1995, and 2014). That’s some impressive company!
If you’d like to read our thoughts on recent performance plus our outlook for the rest of the year, check out our weekly Bespoke Report. Sign up for a month to any of Bespoke’s premium membership levels for just $1!

With the third quarter coming to an end today, earlier today we did a post updating our asset class performance matrix using key ETFs traded on US exchanges. This is a great way to quickly see how various asset classes are performing on a total return basis. Looking through the performance figures, one thing that is hard to find is losers! Year to date, only five of the 58 ETFs in the matrix were down, and in Q3 just four were down. Call us crazy, but with everything seemingly winning, is the market starting to resemble kids little league?
If you’d like to read our thoughts on recent performance plus our outlook for the rest of the year, check out our weekly Bespoke Report. Sign up for a month to any of Bespoke’s premium membership levels for just $1!
Have a great weekend!