Jun 1, 2018
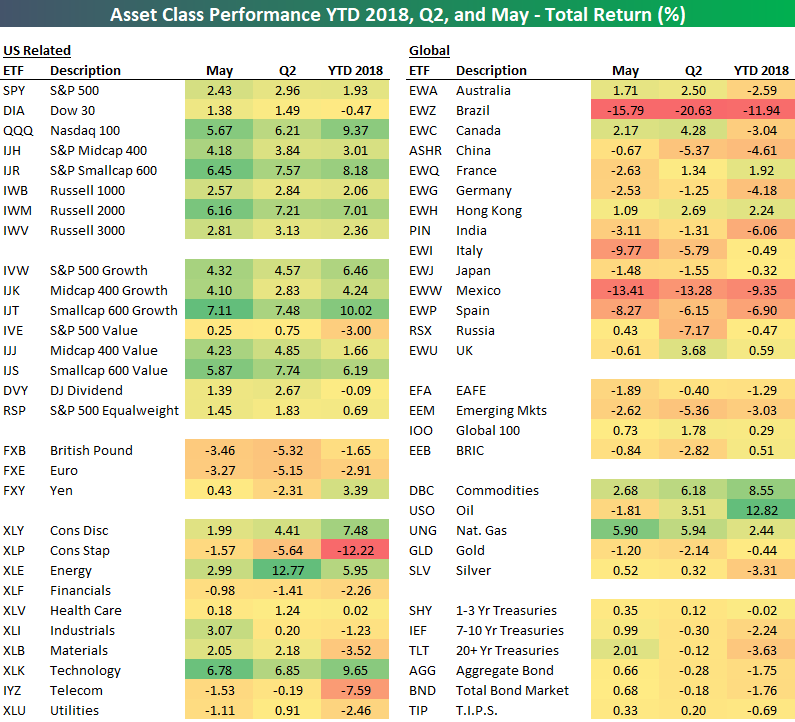
We’ve just published our weekly Bespoke Report newsletter, which is available to subscribers across all three of our membership levels. You can read it now by choosing a membership option and starting a two-week free trial at this page. Below is one of many graphics included in our weekly newsletter. This specific one shows recent performance across asset classes using key ETFs traded on US exchanges.
We go into much more detail in the newsletter, but quickly — note how well US stocks did in May versus the rest of the world.
To find out what this trend of US outperformance means, choose any membership option and access this week’s full Bespoke Report newsletter after signing up! You won’t be disappointed.
May 11, 2018
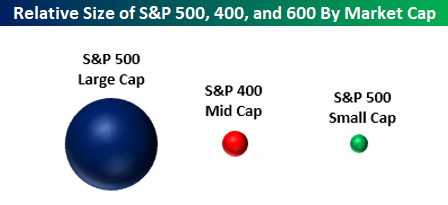
In this week’s Bespoke Report, one of the many topics covered was market weightings and market caps. The bubble chart below shows representations of the size of the large-cap S&P 500, the mid-cap S&P 400, and the small-cap S&P 600. When we speak with a lot of investors, we often hear these asset classes discussed like they are interchangeable. The reality is that they are very different. The S&P 500 is 29 times the size of the S&P 600 small cap index. Therefore, while it has little impact for an individual investor, collectively speaking, any new money in (or out) of the market will have a much more significant impact on small caps than it will on large caps. Think of it like dropping an ice cube in a full glass of water versus a bathtub.
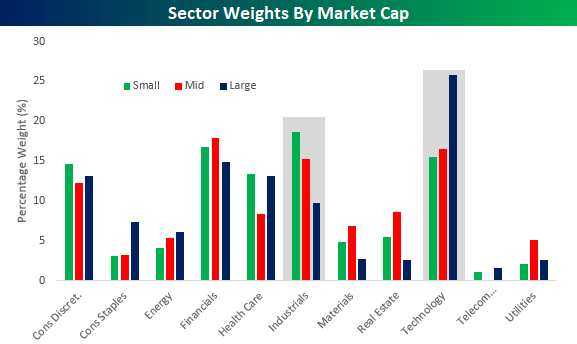
A second chart we wanted to highlight was sector weightings by market cap. While the Technology sector’s weighting is abnormally large in the S&P 500 large-cap index at over 25%, within the small and mid-cap indices, it is at a much more reasonable level of around 15%. In the small and mid-cap indices, the sector that has an abnormally large weighting is actually Industrials. Whereas the sector’s weight is under 10% in the S&P 500, it has a weighting of over 15% in the S&P 400 mid-cap index and a weight of over 18% in the S&P 600 small cap index.
With these weighting abnormalities in mind, when the Technology sector rallies, it has an exaggerated impact on large caps relative to small and mid caps, while an Industrials led rally has a more positive impact on mid and small caps.
As mentioned above, these charts are from our just-published weekly Bespoke Report newsletter, which provides an in-depth review of recent market action and events. To read this week’s Bespoke Report in its entirety, start a two-week free trial to any Bespoke membership level by clicking the button below.
May 4, 2018
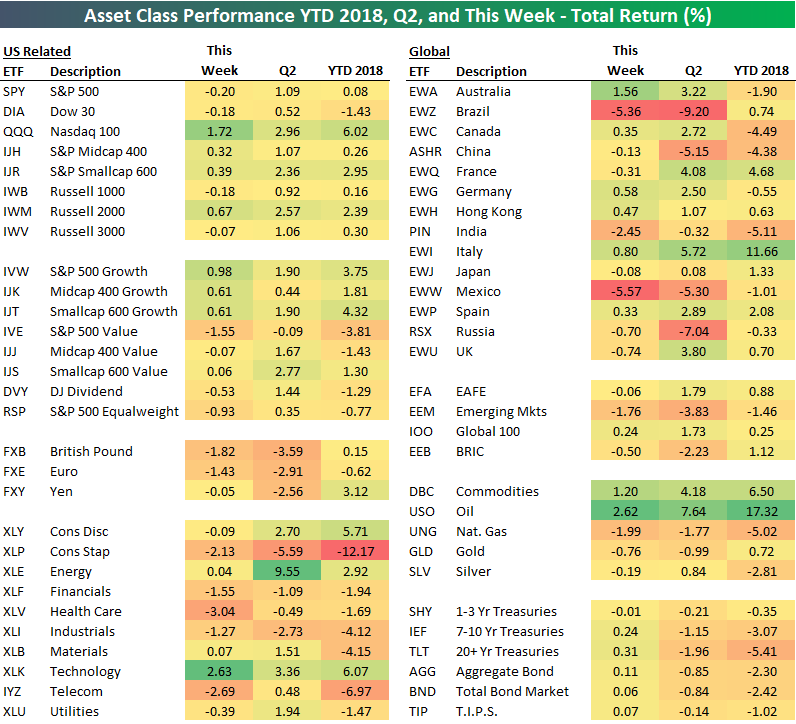
While the S&P 500-tracking SPY ETF fell 20 basis points on the week, the Nasdaq 100 (QQQ) rallied 1.72%. Looking at sectors, most fell, while Tech (XLK) was the only area of strength with a gain of 2.63%.
Outside of the US, both Brazil (EWZ) and Mexico (EWW) fell 5%+, while Australia (EWA) was the only country to gain more than 1%. And while oil (USO) rallied, gold (GLD) and silver (SLV) declined.
We’ve just published our weekly Bespoke Report newsletter, which provides an in-depth review of recent market action and events. In this week’s report, we also provide two lists of stocks we think look attractive. One list looks at top earnings plays, while the other looks at “domestic” stocks with attractive chart patterns. To read this week’s Bespoke Report, start a two-week free trial by clicking the button below.
