Apr 5, 2019
Following big market moves like we have seen in the last six months, a number of market characteristics tend to change as some new leadership groups emerge and others fall by the wayside. In order to help get a better idea of what sectors and groups have been driving the market, in this week’s Bespoke Report, we are providing a ‘chart checkup’ of all the S&P 500 Industries as well as providing updates to some key market and economic charts that we feel are important to highlight.
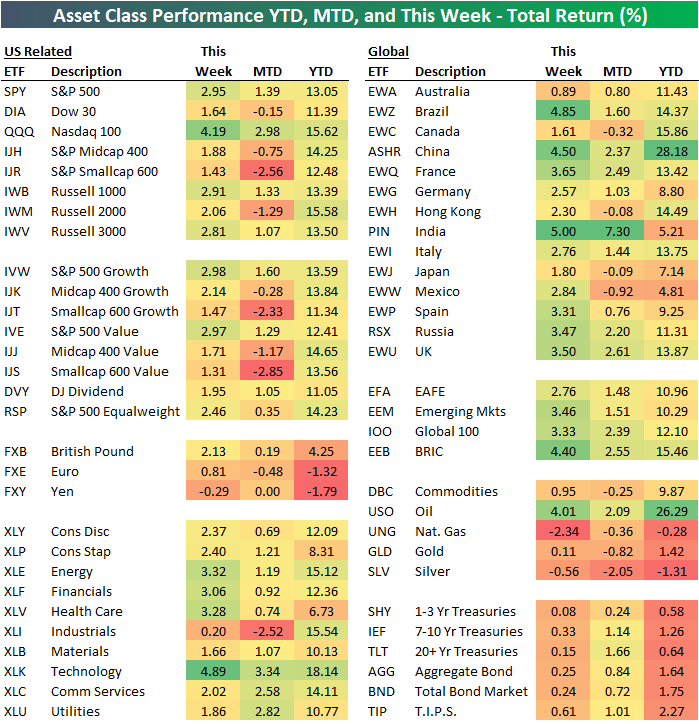
It was a banner week for US equities and a great encore to a strong first quarter. With the exception of the Dow (DIA), every major index ETF was up over 2%. Value outperformed growth across all three market caps, but the margin between the two was pretty narrow. Defensive sectors like Consumer Staples (XLP) and Utilities (XLU) actually saw modest declines this week, while Materials (XLB), Financials (XLF), Communication Services (XLC), and Consumer Discretionary (XLY) all rallied over 3%. In international markets, China (ASHR) surged over 7%, while Mexico (EWW) bounced over 5%. Australia (EWA) was the only country up less than 1%. Fixed income ETFs saw modest declines across the board.
This week’s report is loaded with over 95 pages of charts and tables analyzing the various market moves. To read the Bespoke Report and access everything else Bespoke’s research platform has to offer, start a two-week free trial to one of our three membership levels. You won’t be disappointed!


Mar 29, 2019
Stocks have basically held the line this week despite huge moves in interest rates and an ongoing rough run for global economic data. Curve inversion has many forecasting a recession, and we’ve seen a number of recent data releases that make us much more nervous about that outcome than we have been in almost a decade. On the other hand, the pivot to dovishness from global central banks, the relatively modest size and scale of yield curve inversion, some nascent signs of bottoming in global growth, and the nature of the plunge in interest rates are all reasons to not panic. Besides, despite all of the negativity US stocks have held up admirably well, and markets that trend higher on bad news are generally regarded as strong, rather than weak. In short, the outlook could be Good, Bad, or Ugly…depending how you read the tea leaves!
In addition to markets, we take a look at central bank policy, the recession outlook in the US, and weak economic data around the world this week. We cover everything you need to know as an investor in this week’s Bespoke Report newsletter. To read the Bespoke Report and access everything else Bespoke’s research platform has to offer, start a two-week free trial to one of our three membership levels. You won’t be disappointed!
Mar 22, 2019
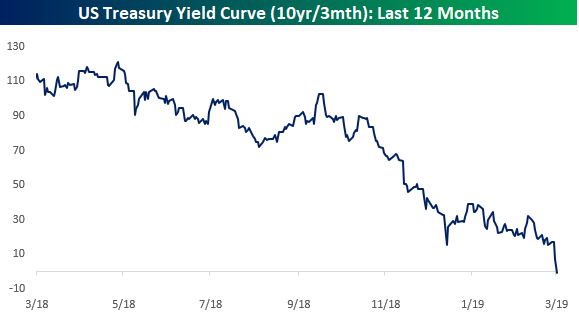
After nice gains over the past week and a half, the S&P 500 fell sharply on Friday as the yield curve inverted for the first time in more than 3,000 days. You can see the dip into negative territory in the chart below:
Along with a recap of all of this week’s economic data and major market events, we also provide an updated take on our market view. We cover everything you need to know as an investor in this week’s Bespoke Report newsletter. To read the Bespoke Report and access everything else Bespoke’s research platform has to offer, start a two-week free trial to one of our three membership levels. You won’t be disappointed!
Mar 15, 2019
Below is an updated look at our ETF Asset Class Performance Matrix, which shows the total returns of key ETFs across assets classes on both a YTD, MTD basis as well as over the last week. How strong were global equity markets this week? Well of all the equity-related ETFs in the matrix, not a single one finished the week in the red. Even Industrials (XLI), which were dragged down by Boeing (BA), managed to eke out a gain of 0.2%. Among US indices, the Nasdaq 100 blew away the field rallying over 4%, but every other US index ETF was up over 1.4%. International markets were even stronger with India (PIN), Brazil (EWZ), and China (ASHR) all rallying more than 4%. Rounding out the four names from BRIC, Russia (RSX) even rallied 3.5%. In terms of YTD leaders, China and Crude oil are neck and neck for the top spot with gains of 25%+.
Along with a recap of all of this week’s economic data and major market events, we also provide an updated take on our market view. We cover everything you need to know as an investor in this week’s Bespoke Report newsletter. To read the Bespoke Report and access everything else Bespoke’s research platform has to offer, start a two-week free trial to one of our three membership levels. You won’t be disappointed!
Mar 8, 2019
Global equity markets had a rough week, but the US staged a nice intraday rally on Friday after an NFP-driven gap lower. Global economic data has been rough, but there are reasons for optimism. In this week’s Bespoke Report, we talk about earnings, smart money flows, retail flows, economic data, and upticks in US data we’ve seen since last Friday. For the S&P 500, the technical line in the sand is 2,816, while 10 year yields are desperately clinging to 2.61% support that has held for the past few months.
Along with in-depth earnings season coverage, we review what’s been happening in markets around the world from equities to commodities to credit. We cover everything you need to know as an investor in this week’s Bespoke Report newsletter. To read the Bespoke Report and access everything else Bespoke’s research platform has to offer, start a two-week free trial to one of our three membership levels. You won’t be disappointed!
Mar 1, 2019
This week’s Bespoke Report is an updated version of our “Pros and Cons” edition.
With this report, you’re able to read through it quickly and still get a complete picture of the bull and bear case for US stocks right now. It’s heavy on graphics and light on text, but we let the charts and tables do the talking!
On page two of the report, you’ll see a full list of the pros and cons that we lay out.
To read the Bespoke Report and access everything else Bespoke’s research platform has to offer, start a two-week free trial to one of our three membership levels. You won’t be disappointed!