Jul 10, 2025
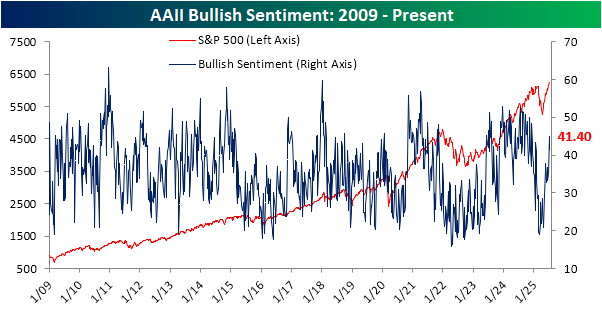
Albeit the move has been mostly recovered by now, the past week’s pullback from fresh all-time highs has resulted in investor sentiment shifting lower. The latest gauge from the weekly AAII survey showed 41.4% of respondents reporting as bullish, down from a 30-week high of 45.0% headed into the July 4th weekend.
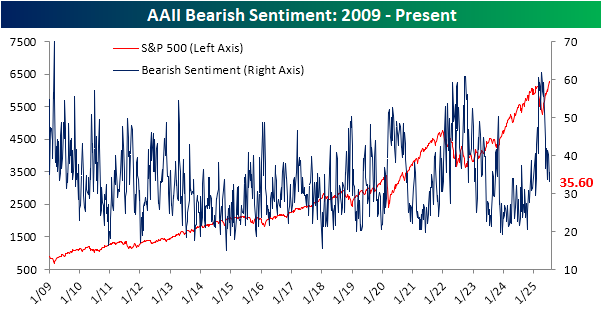
The drop in bullish sentiment meant that an increased share of responses shifted towards bearishness. 35.6% of respondents reported as bearish, up 2.5 percentage points week over week.
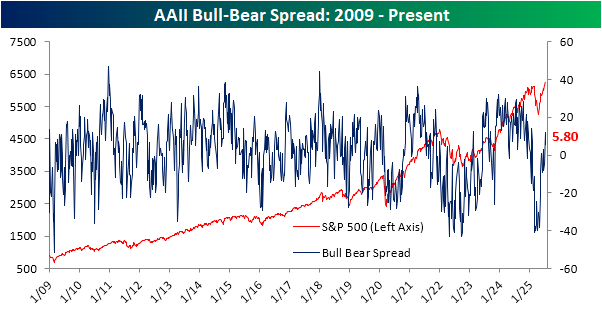
Given these readings, the predominant sentiment is still bullish as the bull-bear spread remains positive for a second week in a row at 5.8 points.
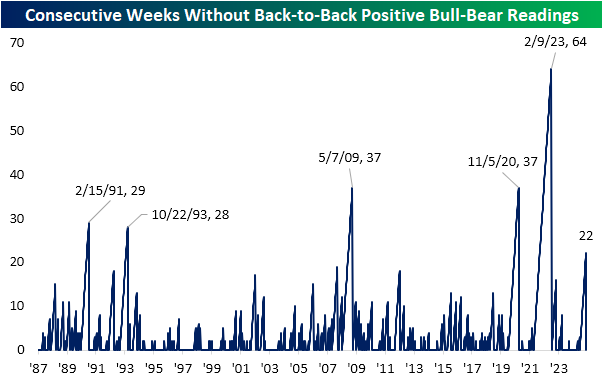
Even though the bull-bear spread was lower this week and current levels are far from earning any superlatives, the still positive reading did mark the first back-to-back positive readings in the spread since the last week of January. Alternatively, that snaps a 22-week-long streak without back-to-back weeks of positive bull-bear spreads. As shown below, such a streak has been uncommon. Throughout the history of the survey since 1987, there have only been five streaks that have gone on for longer.
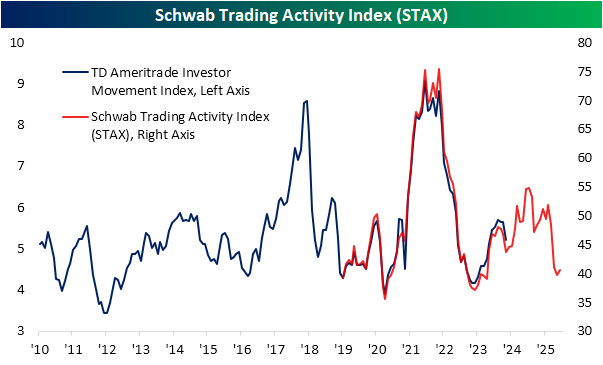
In addition to the usual weekly sentiment gauges, this week also saw an update in the Schwab Trading Activity Index (STAX). Formerly the TD Ameritrade Investor Movement index, before the merger between the two companies, the index differs from other sentiment gauges that tend to ask if an investor is bullish or bearish. Instead, this index uses a proprietary system to assign sentiment scores to retail investors based on their actual account activity. As shown, the June reading only indicated a modest improvement in sentiment after falling for three months in a row. In other words, since the April lows, retail investors had been fading the S&P 500’s recovery back up to record highs, with June only marking a minor shift back toward bullishness among this investor base.
The report also details a few anecdotes about single stocks popular among retail clients. This month’s report highlighted that—again contrary to the changes in these stocks’ prices—recent Tech favorites saw major net selling like NVIDIA (NVDA), Microsoft (MSFT), and Coinbase (COIN). On the other hand, other major Tech names like Tesla (TSLA) and Amazon (AMZN) were noted as seeing consistent purchases among retail investors.
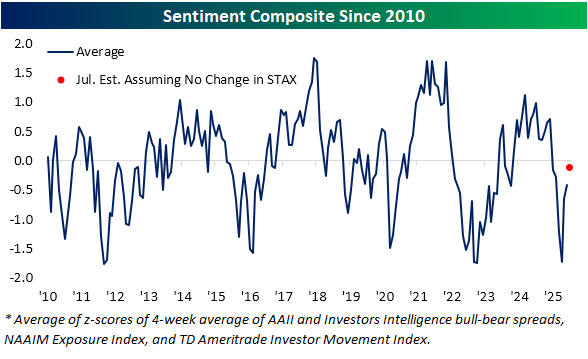
Putting sentiment readings together, below we aggregate this STAX index with the AAII survey and two other weekly sentiment readings: the NAAIM Exposure index and Investors Intelligence survey. Together and equally weighted, the average across these indicators pointed to continued improvements in sentiment in June, and readings for so far in July would point to further improvements down the road.

Jul 9, 2025
Log-in here if you’re a member with access to the Closer.
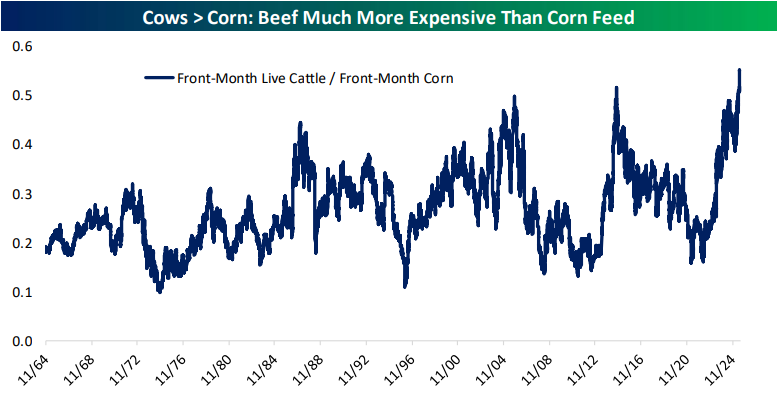
Looking for deeper insight into markets? In tonight’s Closer sent to Bespoke Institutional clients, we lead off with a recap of the June FOMC meeting minutes and what some proxies of retail risk sentiment are showing (page 1). We then dive into commodity markets including a look at the steady rise of cattle prices and drops in cocoa and coffee (page 2). Next, we look at deflation in GPU costs (page 3) and “picks and shovels” plays for that space (page 4). We then finish with a note comparing the housing bubble to AI stock valuations in addition to some commentary on the rising economic importance of Prime Day (page 5).
See today’s full post-market Closer and everything else Bespoke publishes by starting a 14-day trial to Bespoke Institutional today!
Jul 8, 2025
Log-in here if you’re a member with access to the Closer.
Looking for deeper insight into markets? In tonight’s Closer sent to Bespoke Institutional clients, we start with a look at the performance of stocks based on whether or not they turn a profit (page 1) followed by a look into the huge spread in performance between US and London traded copper futures (page 2). After that, we review the latest consumer credit figures (page 3), New York Fed consumer expectation data (pages 4 and 5), and Realtor.com housing figures (pages 6 and 7).

See today’s full post-market Closer and everything else Bespoke publishes by starting a 14-day trial to Bespoke Institutional today!
Jul 8, 2025
Early this morning, the NFIB published their June report on small business sentiment. We discussed some details of the report in today’s Morning Lineup, but to recap, the headline reading came in slightly lower and inline with expectations at 98.6. As we often note, this survey is politically sensitive with a bias towards Republican administrations. As such, the index surged in the wake of the election, and after pulling back significantly earlier this year, it now remains in the middle of that range, which is also lower than it was for much of the first Trump administration.

In spite of the minor change to the headline number, there were some interesting findings throughout the rest of the report. Apart from the headline index, there are parts of the report with less political sensitivity and more economic importance that are concerning. Two such areas with notable weakness were employment and capital expenditures. As shown below, the indices tracking actual changes to those areas of business have fallen sharply in recent months. For employment, current levels are at the weakest since August 2022, and the equivalent index for capital expenditures is down to the lowest reading since August 2022. While those new lows do indicate weakness, the declines could also be in part due to seasonality, with similar summer slumps for both indices observed in the past few years.


Holding the caveat of potential seasonality aside, the report offers additional insights in the form of what firms are spending their capex on. As shown below, all categories have fallen significantly in the past few months, with particularly sharp declines in June. The worst declines have been for vehicles and equipment, which are the two largest categories for capex. Vehicles—which is a tariff-impacted area—is tied with the spring of 2020 for the lowest reading of the past decade. Also worth noting is that additional building or land spending is now at a record low in data going back to early 2014.

The report also includes a look at which problems firms claim to be their most important. In another concerning data point for economic activity, 10% reported poor sales as their biggest problem in what was the highest reading for this category since March 2021. On the bright side, inflation continues to be a less important problem, as it was cited by a still high but rapidly declining 11% of respondents.

The drop in inflation as the most important problem gives room for other issues to come to the forefront. With tariff concerns front and center, it should come as no surprise that taxes are now the single biggest concern for small businesses, accounting for 19% of answers. When combined with government red tape, the 28% reading is the highest since November 2021.

As noted earlier, the NFIB historically tends to be sensitive to politics, favoiing Republican administrations. That makes the turn higher in tax and red tape concerns more surprising. Other series in the report further indicate a turn away from those political biases, though. As shown below, when it comes to reasons for positive and negative expansion outlooks, fewer firms point to politics as a good reason to expand, and more point to that as a reason for a negative outlook.
