Apr 14, 2022
Heading into this week, bullish sentiment on the part of individual investors, measured by the weekly AAII survey, was already depressed with less than a quarter of respondents reporting optimistic sentiment. One week later with the S&P 500 continuing to move lower and a couple of hot, but not exactly unexpected, inflation readings in the interim, bullish sentiment has collapsed another 8.9 percentage points to the lowest level since the week of September 3rd, 1992. That’s right, bullish investor sentiment never got this low even at the depths of the pandemic, during the Global Financial Crisis, or during the Dot Com bubble burst. This week marks one of only 35 weeks since the survey began in 1987 that bullish sentiment was below 20%; the most recent being only back in February when it fell to 19.2%.
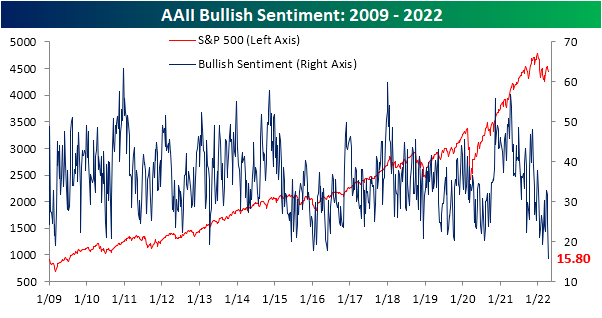
As could be expected, the huge drop and the historic low in bullish sentiment was met with a coincident increase in bearish sentiment. Bearish sentiment rose 7 percentage points to 48.4%. While that is an elevated reading, there have been a couple of even more elevated readings as recently as March 17 (49.8%), February 24 (53.7%), and January 27 (52.9%).

Even though bearish sentiment is not at a new high, the still-elevated reading on pessimism paired with the extremely depressed reading on bullishness has resulted in the bull-bear spread to fall much deeper into negative territory. Only two weeks ago, bulls actually outnumbered bears. Today, bears outnumber bulls by 32.6 percentage points. The 37 point drop since that positive reading marks the largest two-week decline in the bull-bear spread since April 2013. It is also the lowest level of the spread since that same period.

While bearish sentiment picked up, not all of those gains came from the decline in bulls. Neutral sentiment was slightly higher rising 1.8 percentage points to 35.7%. That is a few percentage points above the historical average, but it is also well below the multiple highs of the past year. You can read Bespoke’s full analysis of investor sentiment and its contrarian aspects with a two-week trial to Bespoke Premium.

Apr 13, 2022
Log-in here if you’re a member with access to the Closer.
Looking for deeper insight into markets? In tonight’s Closer sent to Bespoke Institutional clients, we begin with a look at how the most aggressively valued stocks and other factors performed today before following up with a recap of the record PPI data. Next, we review the mediocre long bond reopening before finishing with a look at the record trade surplus of petroleum products.
If you’re wondering what the Closer is like each day, click here or on the thumbnail image below for a sample of a few pages from the report.

See today’s full post-market Closer and everything else Bespoke publishes by starting a 14-day trial to Bespoke Institutional today!
Apr 13, 2022
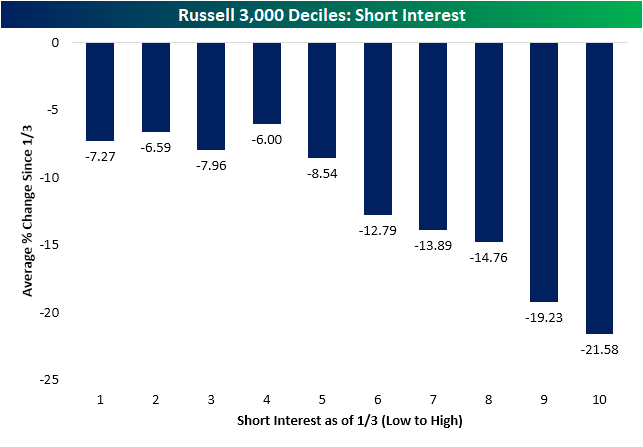
The first quarter of last year was marked by a period of massive short squeezes leading to outperformance of stocks with high levels of short interest. A little over one year later, the opposite has held true. As shown below, the stocks with the highest levels of short interest at the time of the last all time high on January 3rd have been the worst performers over the past few months. The decile of Russell 3,000 stocks with the highest levels of short interest at the start of the year have fallen 21.5% since January 3td while the first four deciles of stocks with the lowest levels of short interest have only fallen mid-single digits.
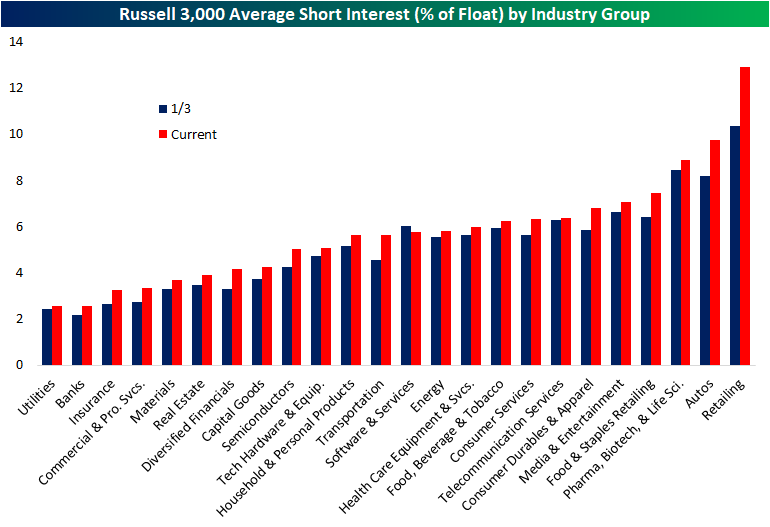
The latest update of short interest data through the end of March hit the tape earlier this week. The average level of short interest as a percent of float for all Russell 3,000 stocks fell sequentially from the mid-March update but with an average short interest reading of 5.78%, current readings are roughly half of one percentage point higher than at the start of the year.
Breaking it down by industry group, retail has seen the biggest increase in average short interest and now has the highest level of any industry group. Autos are the runner-up in both departments as short interest has climbed from 8.2% on January 3rd to 9.75% today. Utilities, Banks, Insurance, Commercial and Professional Services, Materials, and Real Estate, meanwhile, are on the other end of the spectrum as the only sectors with short interest as a percentage of float below 4%.
Turning to individual stocks, Rent the Runway (RENT) now has the most elevated level of short interest as the only stock in the index with over half of its free-floating shares sold short. Conn’s (CONN), however, comes close with 49.16% of its float sold short. Both stocks have seen sharp increases in bearish bets this year as those readings compare to 26.82% and 14.58%, respectively for RENT and CONN. Most of these heavily shorted names have been pain trades this year, but there are a small handful of exceptions. Gogo (GOGO) and Arch Resources (ARCH) have seen substantial rallies of 66.3% and 72.45%, respectively, as the broader market has pulled back. While not as strong of a performance, Dillard’s (DDS) has also rallied solidly gaining 16%.

As previously mentioned, CONN finds itself near the top of the list of the most heavily shorted Russell 3,000 stocks, but it has been the one with the largest increase in short interest of the whole index since the January 3rd high. No other name has seen short interest rise by more than 30 percentage points in that time, but MedAvail (MDVL), Rent the Runway (RENT), and Frontier (ULCC) have seen readings rise over 20 percentage points. Click here to view Bespoke’s premium membership options.
