Apr 18, 2022
As the national average for a 30-year fixed rate mortgage has risen to and remained above 5%, homebuilder sentiment has been reversing its pandemic gains. The NAHB’s monthly homebuilder sentiment index dropped 2 points in April to 77. That was the fourth decline in a row bringing the headline number to the weakest reading since September of last year. That is also now only one point above the December 2019 pre-pandemic high.

The decline this month was mostly driven by a decrease in traffic. That index dropped 6 points to 66 which is the weakest level and the biggest one-month decline since last August. Meanwhile, present sales dropped 2 points for the second month in a row. On the bright side, future sales actually ticked up 3 points to snap a three-month losing streak. That being said, the current level of this index is much less elevated within its historical range compared to the others.

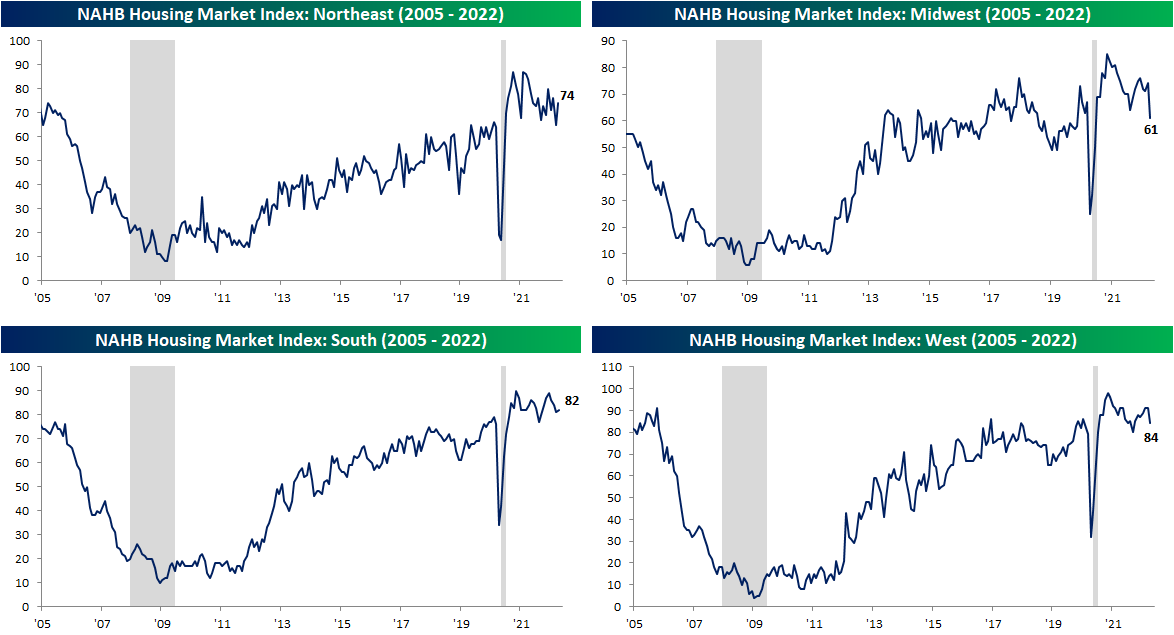
Geographically, there are some large divergences in homebuilder sentiment. For starters, the Northeast showed the most impressive improvement with the index rising 9 points month over month. Whereas last month it was the lowest within its respective historical range, today it is the most elevated. The South also saw an improvement as this region has perhaps been the most stable across the pandemic years. The West and Midwest were other stories entirely in April. The Midwest experienced its second-largest decline on record behind the 42 point drop in April 2020 and is now at the lowest level since June 2020. Meanwhile, the West fell 7 points. That also was the biggest drop in two years though the index saw an even lower reading as recently as last September.
As homebuilder sentiment drops, so too have homebuilder stocks. The iShares US Home Construction ETF (ITB) — which tracks the space — has been falling sharply since peaking around the turn of the year. Click here to view Bespoke’s premium membership options.

Apr 18, 2022
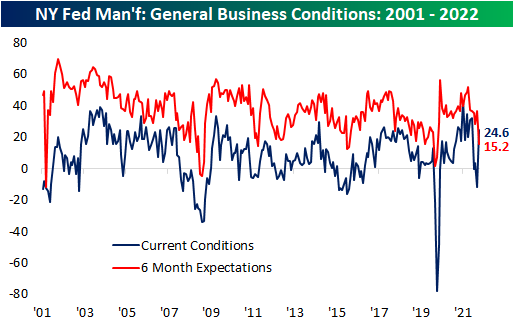
Even though markets were shuttered on Friday for the Good Friday holiday, the New York Federal Reserve branch released the latest update on their monthly manufacturing report with astounding results. Heading into the release, the March reading had shown a significant decline back into negative territory indicating the region’s manufacturers reported contractionary overall activity. In April, activity rebounded substantially with the headline number rising 36.4 points all the way up to 24.6. That set the second-largest month-over-month increase on record behind the 48.3-point jump back in June 2020. In terms of the level of the index, it brought it from a lower decile reading to levels just shy of the upper decile of its historical range going back to the start of the survey in the early 2000s.
Although current conditions were impressive, we would caution that expectations soured in an equally dramatic fashion. The six-month expectation index dropped 21.4 points to 15.2. That was only 0.3 points shy of the second-largest decline on record (21.7 point decline in March 2020) but was far better than the 61 point drop after 9/11 in the early days of the survey.
The move higher in General Business Conditions was thanks to big turnarounds in New Orders and Shipments but breadth elsewhere in the report was not as positive. Of the seven other categories, four declined month over month with three of those declines ranking in the bottom decile of each one’s respective histories. Again, expectations were much more worrisome with large declines across categories and readings in the bottom few percentiles for things like New Orders, Shipments, and Unfilled Orders. Overall, the report showed solid improvements in conditions but how sustainable those improvements will be in the coming months could come into question.

The biggest contributors to the increase in the headline reading were improvements in New Orders and Shipments. Each one crossed back into the top decile of their historical ranges on some of the biggest month-over-month increases on record outside of the spring of 2020. Unfilled Orders were also higher, though, unlike New Orders or Shipments, the index is coming off of already elevated levels. Given the strength in demand and shipments, inventories grew at a slower rate. Expectations were much less optimistic as across all four of these categories there were near-record declines. Unfilled Orders and Inventories even fell into contraction. That means that although New York area firms witnessed solid improvement in business conditions in April, the positive changes are not expected to keep pace or continue in the months ahead.

One likely reason for the big improvements this month was the easing of supply chain stress. The index of Delivery Times fell back down to the low end of its elevated pandemic range in April (higher readings indicate products are taking longer to reach their destination).

Those improvements in current conditions did not filter through to employment. While the region’s firms are on net still increasing hiring, the index for Number of Employees fell to the lowest level since October 2020 after two months of the largest MoM declines since the onset of the pandemic. As hiring decelerates, the average workweek did tick up solidly. That index rose 6.5 points to 10. Click here to view Bespoke’s premium membership options.

Apr 14, 2022
After coming in at one of the lowest levels on record last week, seasonally adjusted initial jobless claims bounced up to 185K this week. While higher, jobless claims are still historically strong having spent a record eight straight weeks with sub-200K readings.

As we noted last week, seasonal adjustments overstated the strength of claims as unadjusted claims experienced a seasonally unusual decline. This week was more normal from a seasonal perspective with initial claims rising from 194.4K to 222.5K and the first reading above 200K since the week of March 11. As shown in the second chart below, the current week of the year has consistently seen claims move higher week over week marking a temporary high before resuming the seasonal downtrend through the next couple of months. That means the slight uptick this month is likely mostly seasonal and far from any sort of a change in trend.

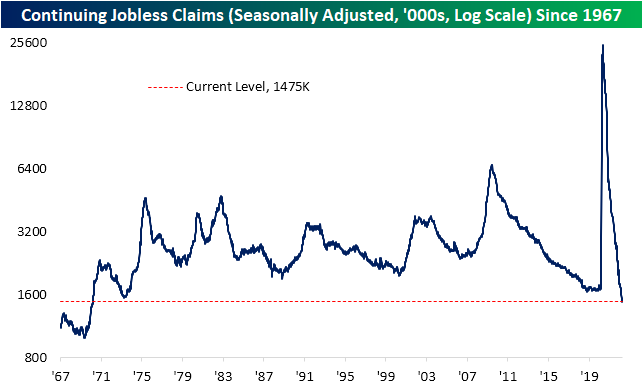
Lagged one week to initial claims, continuing jobless claims fell to a new low of 1.475 million. That is the lowest level of claims since March 1970. Click here to view Bespoke’s premium membership options.