Apr 21, 2022
Seasonally adjusted initial jobless claims remain off of the low from one month ago, but this week did see a sequential improvement. Claims dropped by 2K to 184K from last week’s slightly upwardly revised level of 186K. That is the ninth week in a row with sub-200K prints as claims sit at some of the lowest levels on record.

Before seasonal adjustment, claims were also impressive falling from 224.1K to 196.9K as the brief seasonal uptick at this point of the year unwinds. As shown in the second chart below, the current week of the year has only seen claims rise week over week 12% of the time historically. Claims will likely continue to see seasonal tailwinds through the next several weeks before a seasonal increase in the late spring and summer.

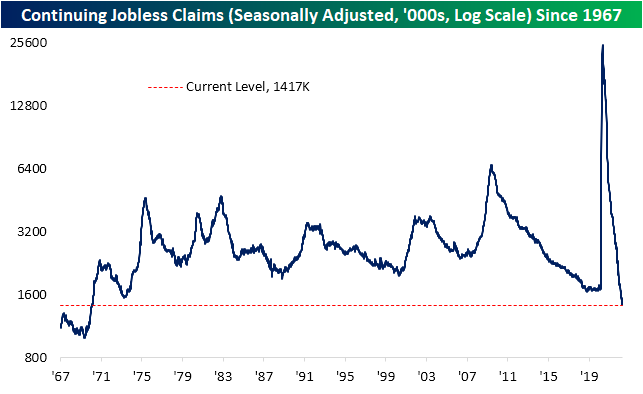
Lagged one week to initial claims, continuing claims came in below expectations of 1.459 million, reaching a new low of 1.417 million. That sets the lowest level since February 1970. Click here to view Bespoke’s premium membership options.
Apr 20, 2022
Log-in here if you’re a member with access to the Closer.
Looking for deeper insight into markets? In tonight’s Closer sent to Bespoke Institutional clients, we take a look at the historic hit to housing affordability shown through the latest existing home sales data. We also dive into tonight’s earnings reports, the Beige Book, record demand in the 20 year Treasury reopening, and very strong EIA data:

See today’s full post-market Closer and everything else Bespoke publishes by starting a 14-day trial to Bespoke Institutional today!
Apr 20, 2022
US Treasury yields have continued to move higher with mortgage rates rising in tow (we explained some key distinguishing characteristics of mortgages versus Treasuries in last night’s Closer). Bankrate.com’s national average for a 30-year fixed rate mortgage has now eclipsed 5.25% in the past week which is an over 2 percentage point increase year over year. Since the start of this series on mortgage rates going back to the late 1990s, that is by far the largest year-over-year increase on record.

Higher rates mean less attractive affordability so purchase applications have continued to fall per the latest Mortgage Bankers Association data. Seasonally adjusted purchase applications dropped 3% this week and are hovering just above the February lows.

The spring is often the hottest time of the year for housing activity. As shown below, the few weeks surrounding the current one have often marked the annual high (blue dots in chart below) in non-seasonally adjusted purchase applications over the past decade. This year that might not be the case. Activity has been running below that of the prior year and has plateaued more recently as mortgage rates have taken off. At the moment, this year’s high was set a little over a month ago in the second week of March. While a new high for the year is still within tangible reach from current levels—meaning upcoming weeks could still very well experience an uptick to a new high—this year has the potential to see a much earlier than usual high in mortgage purchases.

Refinance applications meanwhile are far weaker with unrelenting declines recently. This week marked the sixth week over week decline in a row leaving the MBA’s refinance index at the lowest level since February 2019. Click here to learn more about Bespoke’s premium stock market research service.
