The Closer – Big Reversals, Tech Selling, Factory Supply Chain, 5y TIPS – 4/21/22
Log-in here if you’re a member with access to the Closer.
Looking for deeper insight into markets? In tonight’s Closer sent to Bespoke Institutional clients, we highlight prior times that the S&P has seen 1% intraday gains turn into 1%+ losses and how the index has performed in the days and weeks following (pg. 2). We also dive into this evening’s key earnings reports (pg. 1) and show how supply chains are easing a bit from our Five Fed Manufacturing data (pg. 5). Finally, make sure to check out our analysis on Indeed job posting data (pg. 7). There are some really interesting demographic trends that you might not know about!

See today’s full post-market Closer and everything else Bespoke publishes by starting a 14-day trial to Bespoke Institutional today!
Bespoke’s Weekly Sector Snapshot — 4/21/22
This content is for members onlyPhilly Fed Flips the Script
Today’s release of the Philadelphia Fed’s Business Outlook survey essentially saw the opposite results of last Friday’s Empire Fed release. Whereas the New York Fed’s headline number surged, the Philly Fed reading dropped from 27.4 to 17.6, well below expectations of 21.4.
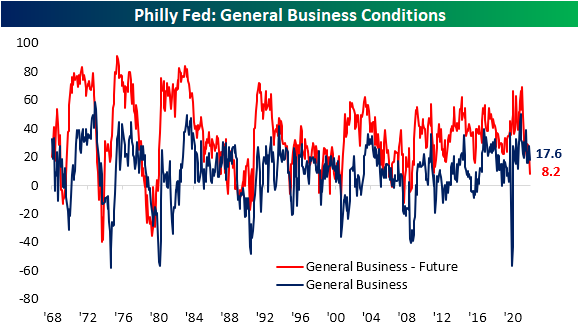
Even though current conditions indices of the two regional Fed surveys released so far this month mirrored one another, both were on the same page for future expectations. Like the Empire Fed, the Philly Fed saw broad declines across expectations indices. In fact, the only index that rose month over month was Unfilled Orders.

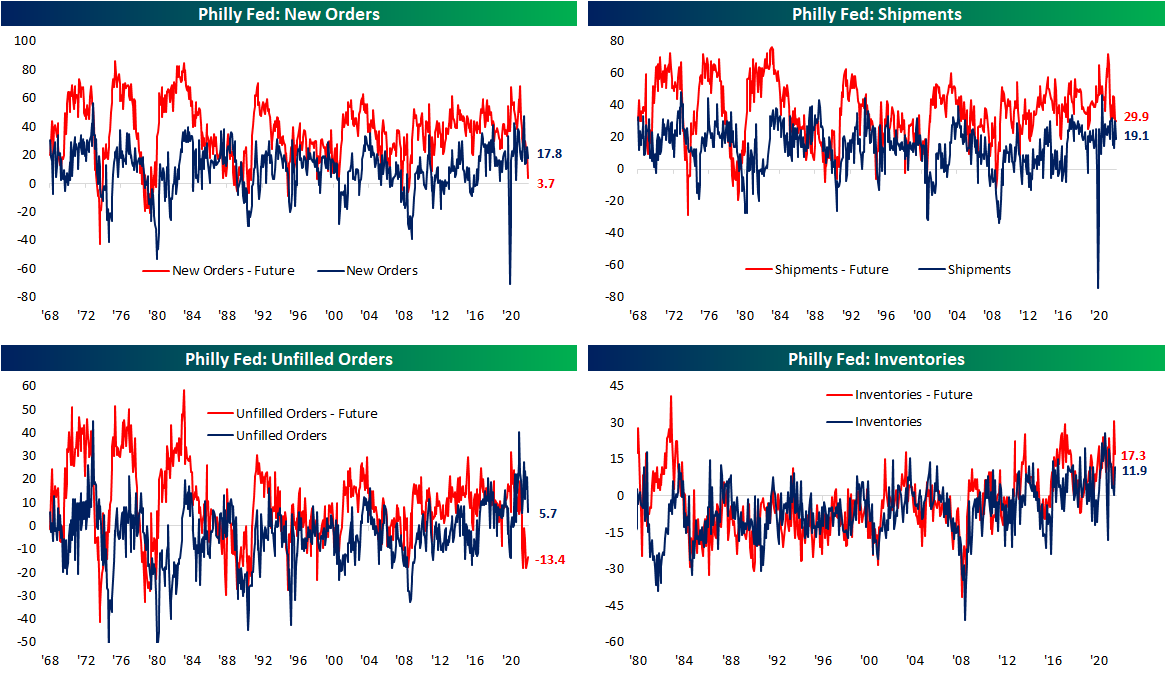
The April report showed a notable slowing of demand as New Orders fell 8 points, and that was the best of any demand-related index. Shipments and Unfilled Orders both dropped double digits. While still indicative of growth, just at a slower rate, these indices have fallen from upper quintile readings down to the 60th percentile range. Expectations indices are far more depressed. New Orders and Unfilled Orders are only in the 5th and 6th percentiles of their historical ranges, respectively. Ironically, Unfilled Orders was also the only expectations index to move higher in April. Inventories remain more elevated for both indices for current and future conditions. The former rose back into the upper decile of its range as the latter moderated from a 99th percentile reading last month.
As we noted earlier this week, one hopeful sign for supply chains from the Empire Fed survey was a dramatic improvement in Delivery Times. That was echoed in today’s release. The index sat just off record highs last month but after its third-largest month over month decline on record, the index has fallen all the way back down to 17.9 which is the lowest level since last February. Responding firms also report that they expect delivery times to decline in the future meaning more improvements in supply chains are expected.

Even though supply chains might not be as constrained, that does not mean firms are not paying less. The index for Prices Paid hit a new high for the pandemic with the index rising to 84.6. That is now the highest reading since June 1979. As for how those increases are being passed to consumers, Prices Paid remain off the peak from this past November with only a slightly higher reading month over month in April.

While Prices Paid came close, it was not able to set a record high this month. The index for Number of Employees however did. Moving higher for the third month in a row, this index hit a new record high of 41.4. That means Philly area manufacturers are taking on the highest number of new workers since the beginning of this survey in 1968! The average workweek remains historically elevated and off of recent lows, but that is also well below the highs earlier in the pandemic. Expectations however saw the first negative reading since February 2016. In other words, with a larger number of new hires coming on board, the average workweek is expected to shorten in the near future. Click here to view Bespoke’s premium membership options.

Sentiment Staying Pessimistic
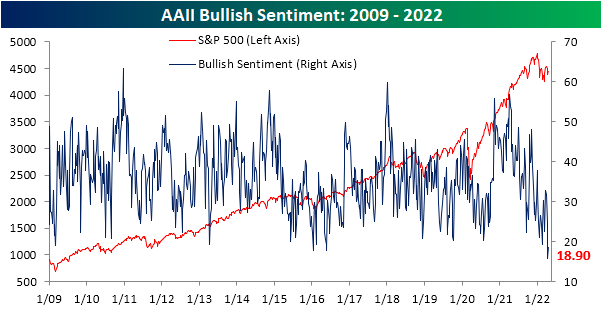
The S&P 500 is once again fighting to gain back some lost ground in the past week. That move higher has been able to lift sentiment slightly, but overall tones remain historically pessimistic. The American Association of Individual Investors weekly sentiment survey showed bulls crawl back up to 18.9% from a historic low of 15.8% reached last week. With less than a fifth of respondents bullish, this remains in the bottom 2% of all weeks on record.
Of course, with bullish sentiment historically depressed, bearish sentiment is historically elevated at 43.9%. That is down from much higher readings of the past year that eclipsed 50% but remains just off the upper decile of its historical range.

As such, bears continue to outnumber bulls by 25 full percentage points. Given the contrarian nature of sentiment indicators, that would still be taken as a positive sign for forward performance of equities as we highlighted on page 6 of last week’s Bespoke Report.

Taking into account other sentiment indicators shows a similar picture. The NAAIM Exposure Index currently sits at 74.05 which is off of the low of 30 from early March while the Investors Intelligence survey saw the first negative bull-bear spread reading in a month this week. Combining these readings, our Sentiment Composite has come off the lows but is still at one of the weaker readings of the past decade. Click here to view Bespoke’s premium membership options.
