Jun 30, 2022
Log-in here if you’re a member with access to the Closer.
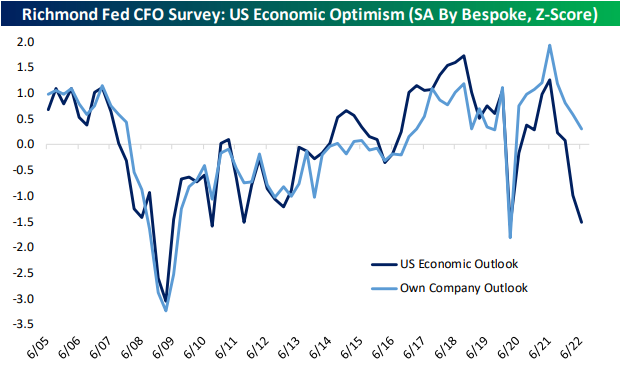
Looking for deeper insight into markets? In tonight’s Closer sent to Bespoke Institutional clients, we begin with a look at crack spreads and the relative performance of refiners versus oil and gas exploration and production stocks. We also show airlines’ performance relative to the S&P 1500 (page 1). Next, we provide a technical look at 5 year yields (page 2) followed by an update of the Richmond Fed’s CFO survey (page 3). We close with an update of some important personal income and spending indictors (page 4).
See today’s full post-market Closer and everything else Bespoke publishes by starting a 14-day trial to Bespoke Institutional today!
Jun 30, 2022
As we noted in today’s Chart of the Day, inflation data has been moderating and so too have gas prices as demand has pulled back and refinery output rises as we discussed in last night’s Closer. Roughly two weeks ago, AAA’s national average price for a gallon of regular gasoline peaked just above $5. Granted it is still elevated, but that price has fallen to $4.86 today. Taking one step further up the supply chain, Gasoline futures peaked even further ago on June 9th and have fallen 14.5% since then. As shown in the second chart below, that decline is now putting the past several month’s uptrend on the ropes.

While both the national average and gasoline futures have been rolling over, the decline in the latter has been far larger as those prices tend to slightly lead retail prices. As for the size of that disconnect, taking the spread of the one-month percent change of the two measures of gasoline is historically wide at 14.4 percentage points. The last times such a divergence has been observed were earlier this spring, last fall, and back in 2020. In those periods, such divergences were short-lived. As shown in the bottom chart where we overall the AAA national average and Front Month Gasoline futures, moves in the futures market tend to lead prices at the pump, in other words, it is unlikely retail prices will continue to fly in the face of lower futures prices. Click here to learn more about Bespoke’s premium stock market research service.


Jun 30, 2022
After two weeks of sub-20% readings, the share of respondents to the AAII sentiment survey reporting as bullish has risen back up to 22.8%. That increase in optimism comes on what has been pretty choppy price action in the past week as the S&P 500 had risen then given up roughly 3% since the last update of the AAII numbers.
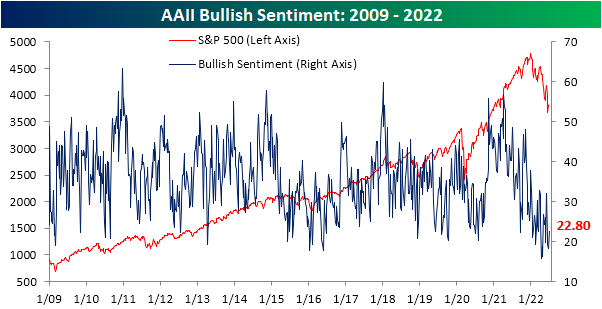
The increase in bullish sentiment broke a streak of back-to-back-to-back declines, and the opposite shift in sentiment could be seen for bearish sentiment. The percentage of respondents reporting as pessimists fell by 12.6 percentage points in the latest week bringing the reading back below 50%. While the double-digit decline was large, the first week of June actually saw an even bigger drop of 16.4 percentage points.
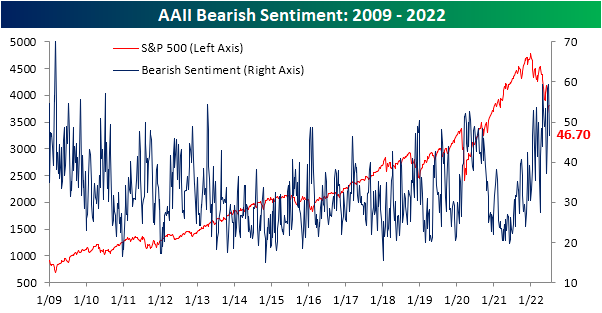
The significant inverse moves in bullish and bearish sentiment have resulted in the bull-bear spread to move higher, but at -23.9, sentiment continues to heavily favor the bears.

In fact, taking a four-week moving average of the bull-bear spread shows that the reading has been below -10 (meaning on average bears have outnumbered bulls by at least 10 percentage points) for 23 straight weeks. That continues to close in on the record six-month streak that ended in February 1991 as bulls are few and far between.

Given the drop in bears this week was far larger than the increase in the number of respondents reporting as bullish, the bulk of the sift went to the neutral camp. That reading rose 8 percentage points to 30.5%. While that only leaves the reading at the highest level since the week of June 9th, it was the largest one-week increase since the last week of March and ranks in the top decile of all week-over-week moves on record. Click here to learn more about Bespoke’s premium stock market research service.

Jun 30, 2022
Seasonally adjusted initial jobless claims came in at 231K which was ever so slightly above expectations of 230K. Meanwhile, last week’s number brought up the low end of the recent range after a 4K upward revision to 233K. That means the most recent read actually showed an improvement versus the previous week whereas before it would have been a modest deterioration in the number. Regardless, claims remain well off of the multi-decade lows from earlier in the spring, but even at current levels, the only historical periods with parallels for as strong of a level were just before the pandemic and the late 1960s to early 1970s.

We would also note that even though claims are up versus the early spring, the reading has seen very little movement in the past month. Quantifying this, the four-week rolling standard deviation in claims has fallen below 1 for only the seventh time on record going back to 1967. The past six times this happened were: April 1988, March 1990, September 2006, August 2016, and June 2019. That is not to say that claims are either improving or deteriorating in any sort of significant way, but rather claims have been remarkably stable in recent weeks.

On a non-seasonally adjusted basis, claims have likewise been little changed over the past few weeks having gone from 206.1K two weeks ago, to 206.4K last week to 207.4K this week. Without much movement, this week’s reading on claims continues to show a stronger reading than comparable weeks pre-pandemic even if they have come off of recent lows from earlier this year.
When taking seasonality into account, as shown in the second chart below, that lack of movement in the claims number is not exactly unwarranted for the current period of the year, but it is likely to change as the next few weeks have consistently seen claims experience a brief and sizable uptick.

Turning over to continuing claims, the rise off of pandemic and multi-decade lows has been much less severe. In the most recent week’s data through June 17th, continuing claims fell from 1.331 million to 1.328 million. Click here to learn more about Bespoke’s premium stock market research service.
