Nov 17, 2025
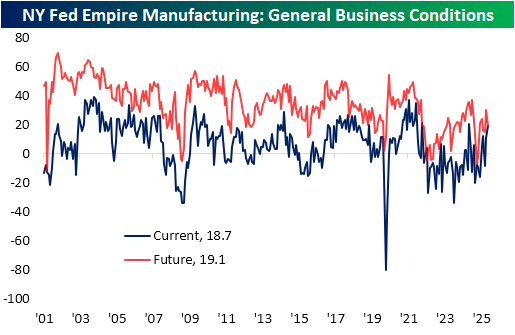
The first regional Fed manufacturing report covering the month of November hit the tape this morning in the form of the New York Fed’s Empire Manufacturing Survey. The headline index rose 8 points month over month to 18.7, moving the index to the top quartile of historical readings. Outside of last November’s reading of 20.2, this was also the highest reading in the index since April 2022.
Breadth in this month’s report was solid, with six of ten categories rising month over month while four declined. Of the decliners, both price indices moderated. New orders picked up materially, as did both employment indices. Current condition indices are mostly solid now, with only two in contraction (unfilled orders and supply availability), and those same two indices are also the only ones below their median historical readings.
Six-month expectations, on the other hand, leave room for improvement. Across the board, only five expectation indices are above their historical median, with the two price indices the most elevated, just shy of top decile readings. The headline index experienced a double-digit drop in November. In other words, the report showed optimism about current conditions but uneasiness for the months ahead.
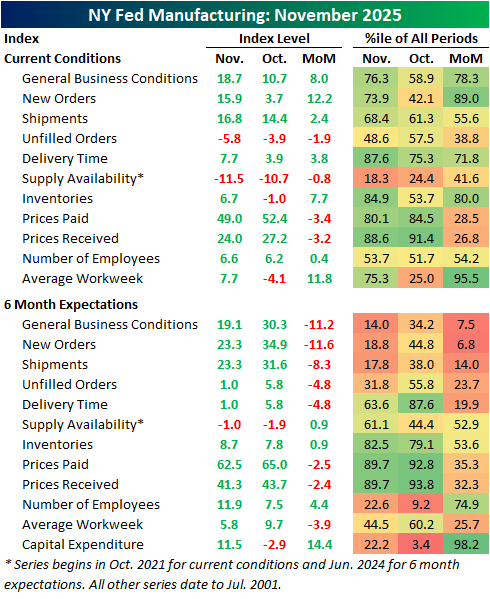
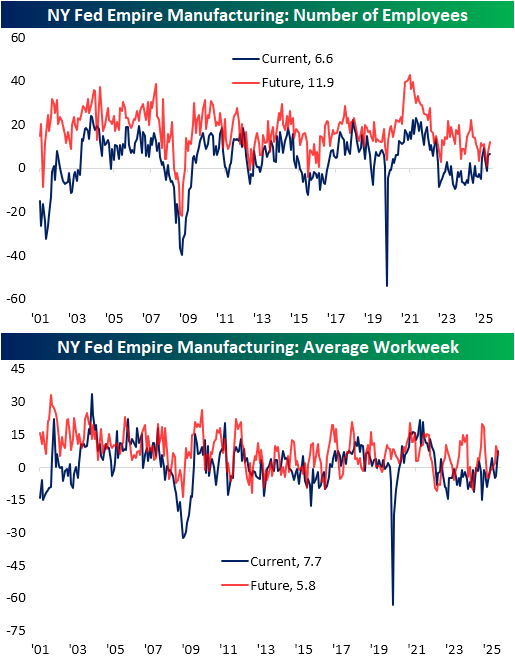
One of the stronger categories for current conditions was employment. Number of employees wasn’t much to write home about, as the current conditions index rose a modest 0.4 points to 6.6. Expectations were also higher, reaching the most elevated reading since January. Average workweek was much stronger as the index surged from contractionary territory, up 11.8 points to 7.7. Put differently, in just one month, that index went from the bottom to the top quartile of historical readings. In fact, the index for current conditions is now the highest since May 2022.
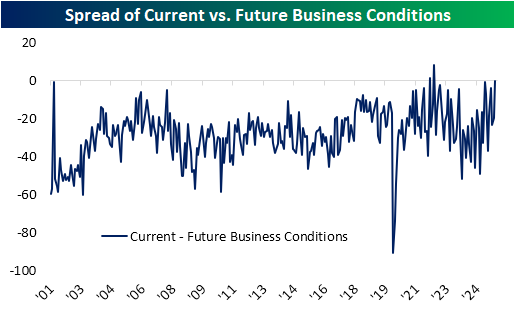
Circling back on the spread between current conditions and expectations, it was a weird month as current conditions improved and expectations deteriorated. Below, we show the spread in those readings for the headline index. As shown, optimism has been the historical norm, as positive spreads (current conditions stronger than expectations) have been extremely rare. In fact, it’s only happened twice, the first in April 2022 and the second a few months later in July 2022. While the November reading wasn’t positive, it came close with the third-highest reading on record at -0.4.
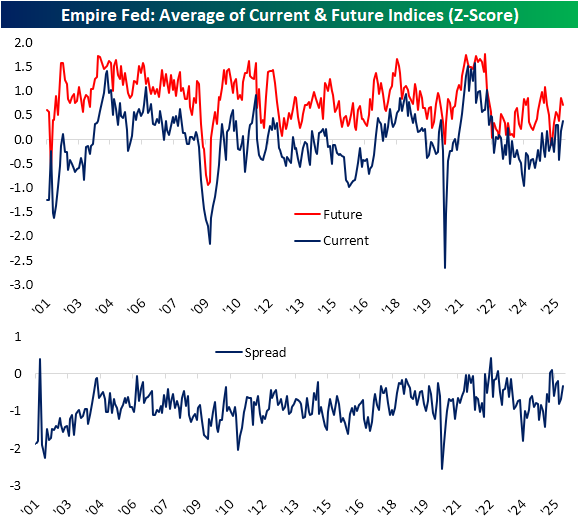
Standardizing and averaging across all categories, the spread between the two is less extreme. Again, current condition indices are solid at the strongest levels since the summer of 2022 while expectation indices were down slightly this month. Taken as a spread, there were higher readings as recently as three months ago, including a rare positive reading in April and May. Regardless, the move upward in November still ranks in the 90th percentile since the start of the survey in 2001.

Nov 13, 2025
Log-in here if you’re a member with access to the Closer.
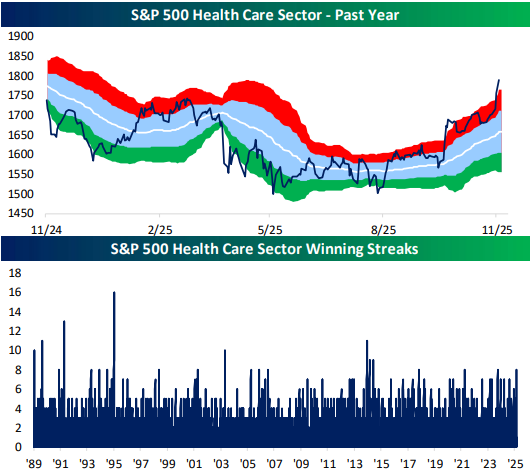
Looking for deeper insight into markets? In tonight’s Closer sent to Bespoke Institutional clients, we lead off with a look at the pain in high beta names (page 1) in addition to a decile analysis and some other charts breaking down where the worst of the selling has been (pages 2 and 3). After a look into some transportation industry data (page 4), we close out with a look into the hot run in Health Care stocks (pages 5 and 6).
See today’s full post-market Closer and everything else Bespoke publishes by starting a 14-day trial to Bespoke Institutional today!
Nov 12, 2025
Log-in here if you’re a member with access to the Closer.
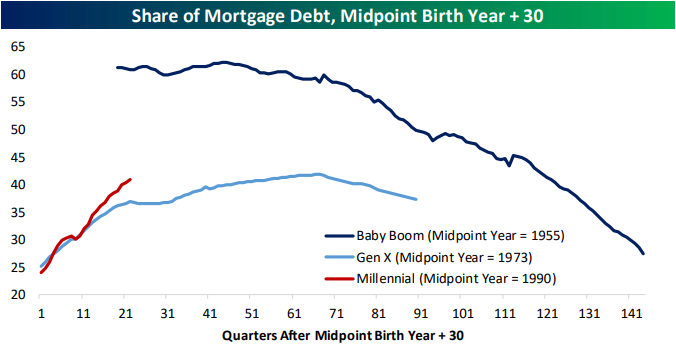
Looking for deeper insight into markets? In tonight’s Closer sent to Bespoke Institutional clients, we start with a review of the elevated rate of triple plays reported this earnings season (page 1). We then dive into generational differences in wealth, incomes, and employment (pages 2 – 5).
See today’s full post-market Closer and everything else Bespoke publishes by starting a 14-day trial to Bespoke Institutional today!
Nov 12, 2025
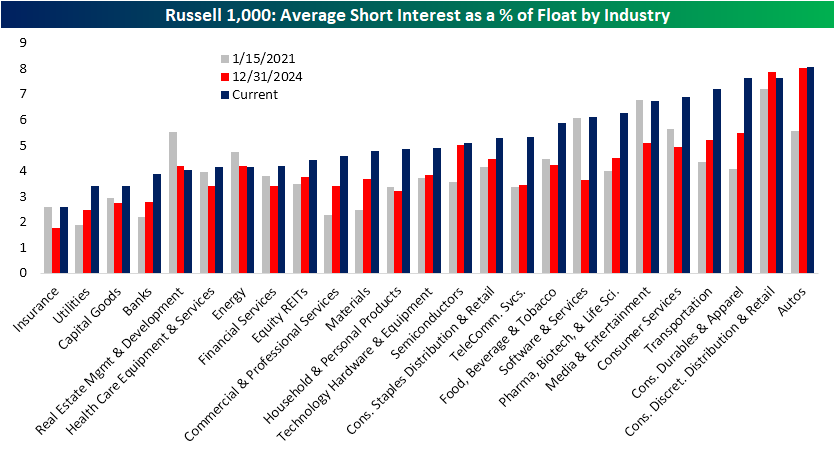
Short interest data through the end of October was published yesterday. For Russell 1,000 stocks, the average stock has 5% of float sold short (median: 3.5%). For the whole of the index, that is up a little over 1 percentage point from the start of the year. In the chart below, we show the average reading across all industries as of 10/31, at the end of last year, and in mid-January 2021, at the height of the meme-stock mania. Current readings are up versus both of those prior periods for Russell 1,000 members. With that said, we would note that for 2021 readings, the Russell 1,000 did not include some of the most heavily shorted and focused-on names like GameStop (GME) and AMC Entertainment (AMC), to name a few.
On an industry level, auto stocks continue to see elevated levels of short interest, largely due to the presence of EV-only names like Lucid (LCID). Behind that, many retailers and consumer-facing stocks make up the list of most shorted, while industries like Consumer Durables and Apparel, Transportation, and Consumer Services have seen some of the largest average increases. Another industry high up on the list of YTD increases has been out of the Tech sector, with Software and Service stocks going from 3.6% average short interest to 6.1% today. Conversely, the only declines in short interest since the start of the year have come out of the Energy and Real Estate Management and Development industries.
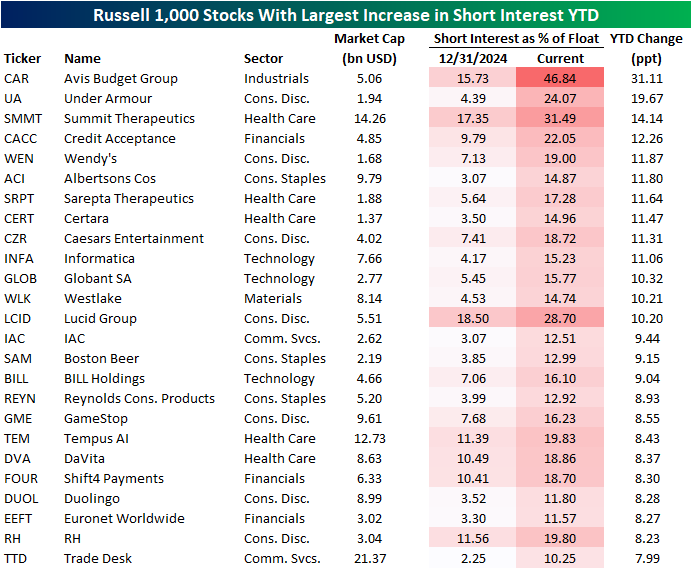
In the table below, we show the individual index members with the highest level of short interest per the latest update. Two stocks have readings above 40%: Avis Budget (CAR) and Circle (CRCL). The latter is a newer stock with an IPO in early June, while the former has seen short interest triple since the start of the year. The third-highest reading in short interest comes from Medical Properties Trust (MPW). While short interest remains high above 30%, it is down from 44.5% entering the year.
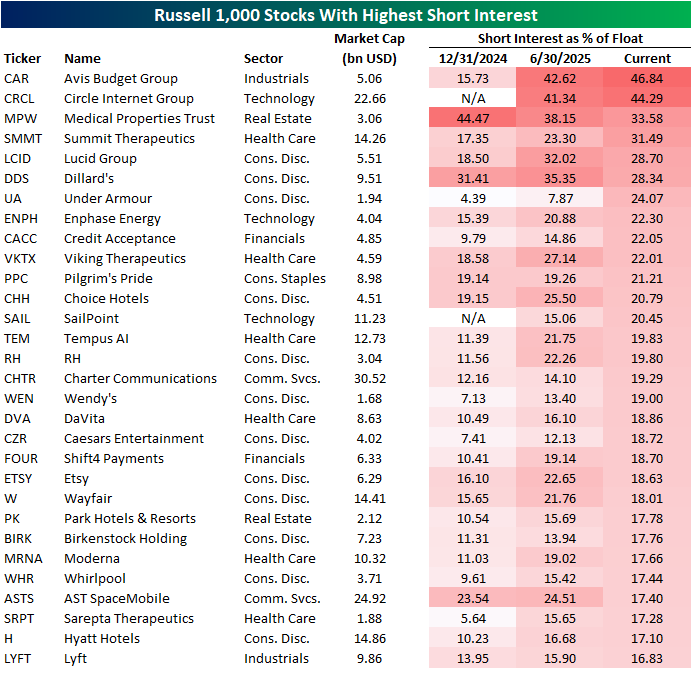
Again, CAR has seen short interest triple this year. That is by far the largest uptick of any current Russell 1,000 members. The next largest increase, Under Armour (UA) has seen an increase of less than 20 percentage points so far, although it started 2025 with a mid-single digit reading.