The Closer – NVDA, Morning Sell Offs, COST Low – 11/19/25
Log-in here if you’re a member with access to the Closer.
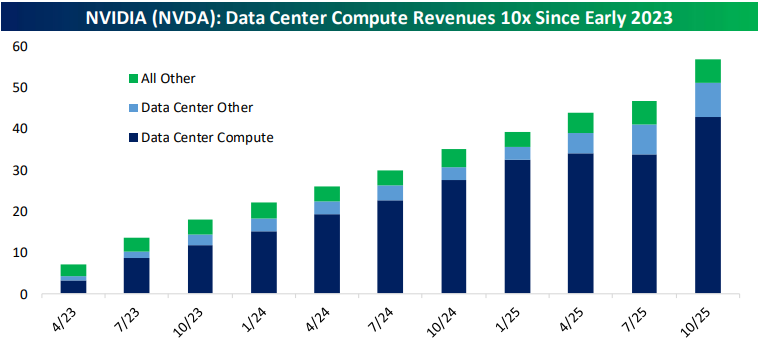
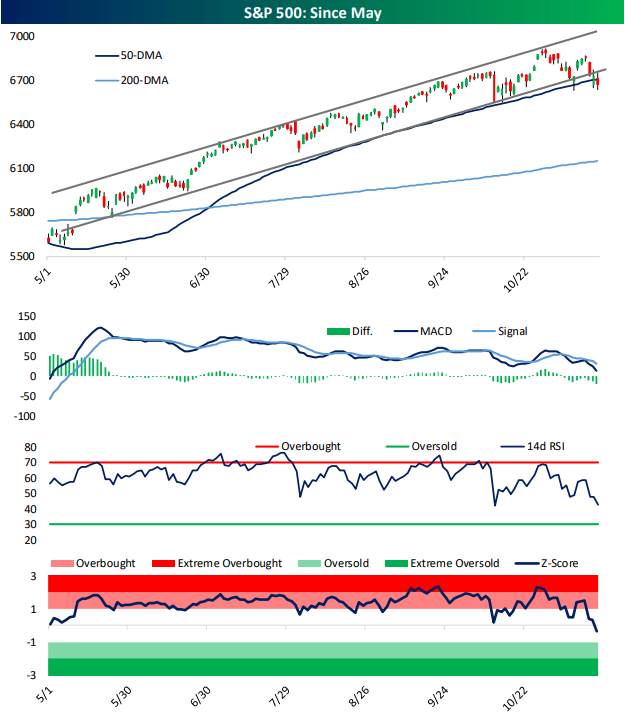
Looking for deeper insight into markets? In tonight’s Closer sent to Bespoke Institutional clients, we start with a dive into the much anticipated earnings report from NIVIDIA (NVDA) (page 1) followed by an updated look at our Picks and Shovels basket (page 2). After that, we check in on how the S&P 500’s intraday pattern has shaped up (page 3) before closing out with a look at Costco (COST) which hit a rare 52-week low today (page 4).
See today’s full post-market Closer and everything else Bespoke publishes by starting a 14-day trial to Bespoke Institutional today!
Chart of the Day – Mega-Cap Fade
This content is for members onlyThe Closer – Jobs, CLO Quality, Credit – 11/18/25
Log-in here if you’re a member with access to the Closer.
Looking for deeper insight into markets? In tonight’s Closer sent to Bespoke Institutional clients, we begin with a look into how jobs data is shaping up (page 1) followed by a look into collateralized loan obligations (page 2), auto ABS, and office CMBS (page 3). Next up, we dive into credit card delinquencies (page 4) and New York Fed consumer credit data (pages 5 and 6).
See today’s full post-market Closer and everything else Bespoke publishes by starting a 14-day trial to Bespoke Institutional today!
The Closer – Baskets & Bitcoin – 11/17/25
Log-in here if you’re a member with access to the Closer.
Looking for deeper insight into markets? In tonight’s Closer sent to Bespoke Institutional clients, we start with an update on major equity index technicals following today’s decline (page 1) in addition to updates on a number of baskets including those tracking momentum, unprofitable tech, private equity, travel stocks, and more (pages 2 & 3). We then review Bitcoin’s bear market (page 4) before diving into the charts of a couple hyper-scalers (page 5). After that, we provide our quarterly update of our Best of Breed Basket (pages 6 & 7). We finish with recaps of the latest economic data (pages 8 & 9).
See today’s full post-market Closer and everything else Bespoke publishes by starting a 14-day trial to Bespoke Institutional today!