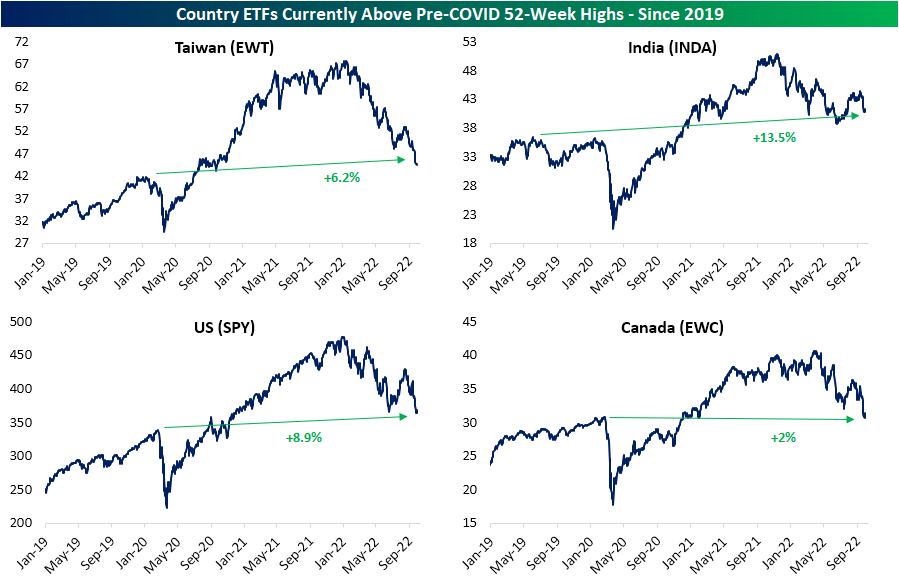
Global Equities Reaching New 52-Week Lows
Being the last Wednesday of the month, today we published our most recent update of our Global Macro Dashboard which provides overviews of 22 major global economies. In the matrix below, we show the performance of ETFs that track the stock markets of these same countries.
Globally, stocks have gotten crushed in the past year with an average decline of 30% from 52-week highs; we would also note that developed markets have faired slightly worse than emerging markets. In fact, in the past few days, nearly every one of these countries has made a new 52-week low. There are a couple of holdouts though: Brazil (EWZ) and India (INDA). Compared to the S&P 500 low on June 16th (which was the 52-week low prior to this week and the level the index is currently hovering near) INDA and EWZ are again the only two countries with a solid gain by any stretch. As for one other distinguishing characteristic, these two countries are the only ones to not be in or be in the process of entering—as is the case with Mexico (EWW)—oversold territory.

While everything is well below current 52-week highs, there are only four country ETFs that are also above pre-COVID highs (the 52-week high as of the S&P 500 high on 2/19/20). India (INDA) is, of course, the most elevated above those levels at 13.5% followed by the US. Taiwan (EWT) and Canada (EWC) are within more tangible reach of pre-COVID highs given their recent breach of spring support has been far more material than SPY. Click here to learn more about Bespoke’s premium stock market research service.
The Closer – Breaking: Pipelines, Assorted Markets, UST Auctions – 9/27/22
Log-in here if you’re a member with access to the Closer.
Looking for deeper insight into markets? In tonight’s Closer sent to Bespoke Institutional clients, we start out tonight with a look at the reasons why this morning’s rebound had its legs kicked out from under it (page 1) followed by an update of Nord Stream pipeline news (page 2). Next, we take a look over some “breaking” markets (page 3) before reviewing today’s very weak 5 year note auction (page 4) and just how weak this month’s Treasury sales have been (page 5). We close with a review of the latest new home sales data (pages 6-8).
See today’s full post-market Closer and everything else Bespoke publishes by starting a 14-day trial to Bespoke Institutional today!
Daily Sector Snapshot — 9/27/22
This content is for members onlyBear Market Breadth
As we highlighted in yesterday’s Chart of the Day as well as in our Sector Snapshot, the S&P 500’s 10-day advance decline (AD) line reached a record low at yesterday’s close. The 10-day AD line essentially measures the percentage of stocks in the S&P that have risen or fallen on a daily basis over a 10-day span. While the broad index saw its 10-day hit a record low, it was not alone. Real Estate (which admittedly has a smaller history of data only going back the past six years) and Technology also saw record low readings while a number of other sectors came close to records as well. As shown below, Materials had the fourth lowest reading, Energy and Industrials had the third lowest, and Health Care had the runner up lowest reading on record. For most sectors, these are readings that are well over 3 standard deviations below the norm since our data begins in 1990.
Additionally, the weak readings are somewhat unusual when compared to other bear markets. As shown, historically the 10-day AD lines of defensive sectors (Consumer Staples, Health Care, Real Estate, and Utilities) as well as Energy have averaged positive readings during bear markets. That is far from the case at the present moment with the strongest reading coming from Consumer Staples, however, even that reading is over 2 standard deviations lower than normal and ranked as the 121st worst reading of all trading days since at least 1990.

Pivoting over to a longer run look at breadth, the cumulative AD line has been confirming the moves in price with the line plummeting down towards the spring lows. That comes after the AD line went on a much stronger run than price during the late spring/summer rally.

Once again comparing the breadth line to past bear markets, below we show the path of the cumulative AD line over the course of each bear market since 1990. At the moment, the current bear is the third longest in terms of time, but the cumulative AD line is not quite at as low of a level as other bear markets. For example, the 2020 bear market as well as the 2007 to 2008 bear markets saw much lower readings and consistent moves lower than has been observed this year. At the highs this summer, the line even managed to move into positive territory. Click here to learn more about Bespoke’s premium stock market research service.

Bespoke Investment Group, LLC believes all information contained in this report to be accurate, but we do not guarantee its accuracy. None of the information in this report or any opinions expressed constitutes a solicitation of the purchase or sale of any securities or commodities. This is not personalized advice. Investors should do their own research and/or work with an investment professional when making portfolio decisions. As always, past performance of any investment is not a guarantee of future results. Bespoke representatives or clients may have positions in securities discussed or mentioned in its published content.