Oct 24, 2022
Log-in here if you’re a member with access to the Closer.
Looking for deeper insight into markets? In tonight’s Closer sent to Bespoke Institutional clients, we begin tonight’s Closer with a look at the record drop in Chinese ADRs (page 1) followed by a look at lumber prices drop back to a normal range (page 2). We follow up with a review of the performance and fundamentals of automakers (page 3). Turning to macro data, we review the latest PMIs (page 4) then preview this week’s primary market Treasury sales (page 5). We close with a review of speculator positioning (pages 6 – 8).

See today’s full post-market Closer and everything else Bespoke publishes by starting a 14-day trial to Bespoke Institutional today!
Oct 24, 2022
As we discussed this morning in the Morning Lineup, news out of China has sent shares of US-listed Chinese stocks tumbling. While that may sound like a concentrated issue, that weak performance actually has interesting implications for a measure of mega-cap stocks. Over the past several years, the NYSE FAANG+ Index has been a well-tracked measure of the mega caps and two members of that index are two of the largest Chinese stocks: Alibaba (BABA) and Baidu (BIDU). Given the index is equal weight, the declines of more than 14% in both stocks today are not weighing too heavily on the index, but we would note their performance drastically changes what would otherwise be a somewhat optimistic-looking chart.
Below we show the NYSE FAANG index as normal and without those Chinese stocks over the past year both indexed to 100 one year ago. The original index (red line) remains firmly in its downtrend over the long term and since the summer. However, when BIDU and BABA are removed (blue line), that summer downtrend has definitively been broken. That is not to say mega-caps have completely reversed the long-term picture, but the FAANG stocks’ short-term chart might be more positive than at face value.

Turning to the individual FAANG stocks’ charts, Microsoft (MSFT) and Apple (AAPL), which as we discussed in today’s Chart of the Day, are scheduled to report on Tuesday and Thursday, respectively, have begun to break out of their summer/fall downtrends. While that is a positive development at least in the near term, there is still resistance ahead at each stock’s moving averages. With the potential catalysts of earnings, later this week we should have a better idea of whether or not those breakouts are pump fakes or the start of something more material.


While those mega-cap moves have been promising to a degree, Amazon (AMZN) has been met with the opposite fate. AMZN likewise attempted to break out of the past few months’ downtrend in the past few days, but today, it has met resistance.

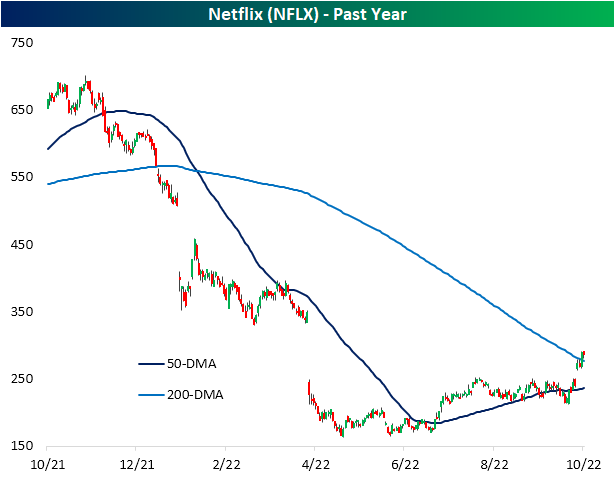
As for another FAANG member that has already reported, Netflix’s (NFLX) recent chart developments have been even more constructive. After a double-digit percentage jump in response to stronger-than-expected subscriber growth last week, NFLX has moved above both its 50 and 200-DMAs and is now filling the massive gap down from its April earnings report when it declined 35% in a single day. Of course, there is plenty of progress left to be made to erase the massive declines of the past year, but the move higher this earnings season has been a welcome relief. Click here to learn more about Bespoke’s premium stock market research service.
Oct 21, 2022
In today’s Morning Lineup, we noted the consistency in which the S&P 500 has finished the week with a decline of 1% or larger this year. Today is not looking to add to that count as the index rallies well over 2%, but it would make for the twelfth week this year and third in a row in which the index has gone into the weekend with a move of 2% or more in absolute terms. As shown below, the only years of the past 70 with a comparable number of weeks has been 2000 (11) and 2008 (12).

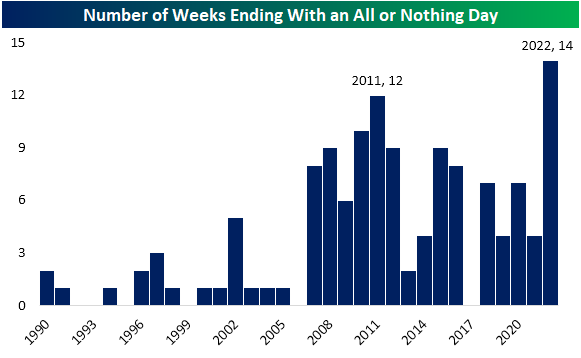
In addition to moving over 2% in absolute terms, there has been breadth to boot. The last three Fridays have been “all or nothing” days (daily advance-decline reading of +/-400). In total on the year, there have now been 14 weeks to end with an “all or nothing” day. No other year since at least 1990 has seen as many with 2011 the closest at 12 weeks. Further, the only other times that there have been similar streaks to the current one were in 2011 and 2016. Click here to learn more about Bespoke’s premium stock market research service.