One of These Indices Is Not Like the Others
Looking across the major US index ETFs in our Trend Analyzer, one stands out (in a negative way) from all the others. At the moment, the Dow is the only major US index in the red on a year-to-date basis as we close the books on February. Even more notable, is the fact that it’s also the only one below its 50-DMA. Not only is it below its 50-day, but it is trading firmly in oversold territory sitting over 1.5 standard deviations below its 50-day. Today that dynamic of Dow underperformance continues as the index is falling another 0.3% as of this writing while the S&P 500, Nasdaq, and Russell 2,000 are all higher.

In the chart below, we show how far the S&P 500 and Dow are trading (in standard deviations) from their respective 50-DMAs over the past five years. For the most part, the two large-cap indices have tracked one another relatively well in spite of their differences in composition and price calculations. That makes the current situation in which the Dow is oversold without the same applying to the S&P 500 somewhat unusual, albeit not without precedence. While uncommon, there have been periods in which the indices have similarly distanced themselves from one another like most recently in the spring and fall of 2021.
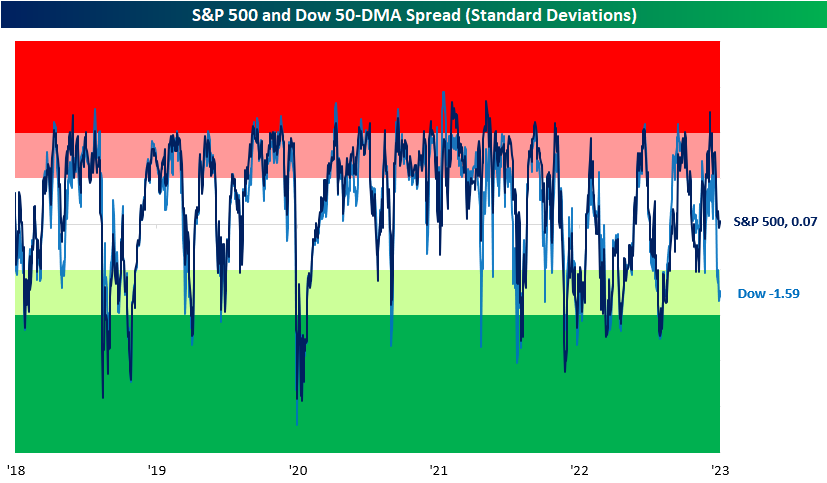
Although there have been other times in which the Dow and S&P’s overbought/oversold readings have deviated from one another, the current example is abnormally large. With a gap of 1.66 standard deviations between the two indices’ overbought/oversold readings versus their 50-DMA spreads, today’s spread ranks in the bottom 1% of all readings since 1952 when the five-day trading week began. Additionally, such low readings have been exceptionally rare in the past 20 years. Outside of June and September of 2021, August 2015 was the last instance of the spread falling this wide with the Dow underperforming. Looking back even further, 2004 was the only other instance of the past 20 years. Click here to learn more about Bespoke’s premium stock market research service.

Tech Relative Strength Still Negative
Each day in our Sector Snapshot, we provide updated charts of the relative strength lines of each sector versus the S&P 500. Outside of a brief period last summer, Technology, the largest sector in terms of market cap, has seen its relative strength line sit in negative territory for nearly the whole of the past year. In other words, the broader market has outperformed the Tech sector almost every day for a year straight. In the chart below, we show the one-year relative strength line of Tech versus the S&P going back to 1991. After some of the most dramatic underperformance of the past couple of decades, Tech rebounded, and the sector has now only underperformed the broader market by a little less than 3% in the past year. While Tech’s relative strength is not as weak as it once was and is closing in on the first positive readings since the mid-summer, today marks the 131st trading day of consecutive negative readings. That is handily the longest streak in nearly a decade and one of only six other times a streak has eclipsed 100 trading days.


The current streak has yet to come to a close, but in the chart below, we show the performance of Tech and the S&P 500 following the conclusion of each of those prior streaks of 100 or more days. Overall, performance does hold a positive bias with positive returns a vast majority of the time. That being said, the average size of those gains is not exactly impressive. In the case of Tech, the average and median gains are smaller than the norm across these time periods. One year out is the starkest difference with an average gain of less than 5% compared to what has typically been a gain that sits in the mid-teens. Likewise, the S&P 500 tends to underperform the norm one year later, but short to medium-term performance is stronger than the norm. Six-month returns, in particular, have been impressive with a move higher every time and an average gain that is more than double that of the typical six-month performance since 1991. Click here to learn more about Bespoke’s premium stock market research service.

The Closer – Listless Market, 60/40, Manufacturing Momentum – 2/27/23
Log-in here if you’re a member with access to the Closer.
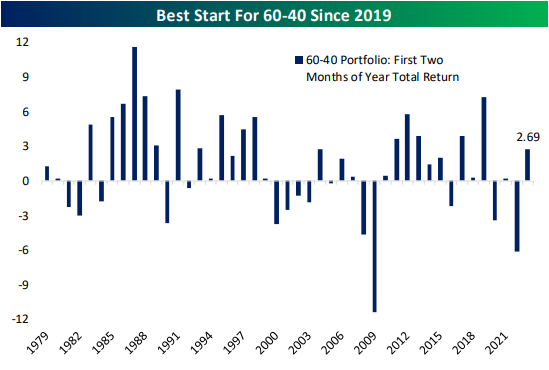
Looking for deeper insight into markets? In tonight’s Closer sent to Bespoke Institutional clients, we start out with a decile breakdown of today’s price action based on analyst estimates, operating margins, 2022 performance, and short interest (page 1). We then check in on 60-40 portfolio returns (page 2). Switching to macro data, we provide a look at the latest manufacturing orders figures (page 3) followed by a final update of our5 Fed Manufacturing Composite (page 4).
See today’s full post-market Closer and everything else Bespoke publishes by starting a 14-day trial to Bespoke Institutional today!