Mar 24, 2023
We are now three years out from the COVID Crash low, and even with the past year’s weakness, most assets continue to sit on solid gains. For major US index ETFs, the S&P Midcap 400 (IJH) is up the most having slightly more than doubled while the S&P Smallcap 600 (IJR) is not far behind having rallied 95.9%. Value has generally outperformed growth, especially for mid and small-caps although that has shifted somewhat this year. For example, while its gains have been more middling since the COVID crash, the Nasdaq 100 (QQQ) has been the strongest area of the equity market in 2023 thanks to the strength of sectors like Tech (XLK) and Communication Services (XLC). Although those sectors have posted strong gains this year, they have been the weakest over the past three years while Energy (XLE) far and away has been the strongest asset class. Paired with the strength of energy stocks has been solid runs in commodities (DBC)more broadly with the notable exception being Natural Gas (UNG) which has lost over 40%. Bond ETFs are similarly sitting on losses since the COVID Crash lows. As for international markets, Mexico (EWW) and India (PIN) have outpaced the rest of the world although Emerging Markets (EEM) as a whole have not been particularly strong; likely being dragged on by the weaker performance of China (ASHR) which holds a large weight on EEM.

Taking a look at current S&P 500 members, nearly half of the index has more than doubled over the past three years. As for the absolute best performers, Energy stocks dominate the list with four of the top five best-performing S&P 500 stocks coming from that sector. Targa Resources (TRGP) has been the absolute best performer with a nearly 900% total return. Other notables include a couple of heavy weight stocks: Tesla (TSLA) and NVIDIA (NVDA) with gains of 563.9% and 412.9%, respectively.

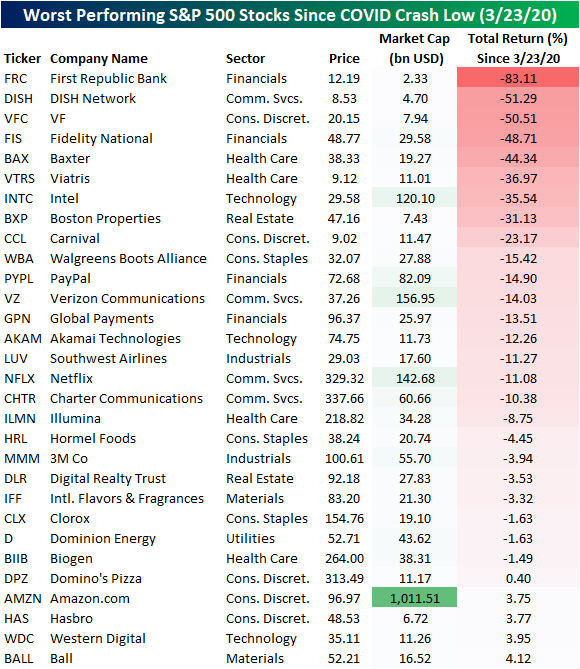
On the other end of the spectrum, there are currently 25 stocks that have posted a negative return since the COVID Crash low. The worst has been First Republic Bank (FRC) which has been more of a recent development. Whereas today the stock has posted an 83.1% loss, at the start of this month it would have been a 65% gain. Another standout on the list of worst performers has been Amazon (AMZN). Most other mega caps have more than doubled since the March 2020 S&P 500 low, however, the e-commerce giant has hardly offered a positive return.
Have you tried Bespoke All Access yet?
Bespoke’s All Access research package is quick-hitting, actionable, and easily digestible. Bespoke’s unique data points and analysis help investors better visualize underlying market trends to ultimately make more informed investment decisions.
Our daily research consists of a pre-market note, a post-market note, and our Chart of the Day. These three daily reports are supplemented with additional research pieces covering ETFs and asset allocation trends, global macro analysis, earnings and conference call analysis, market breadth and internals, economic indicator databases, growth and dividend income stock baskets, and unique interactive trading tools.
Click here to sign up for a one-month trial to Bespoke All Access, or you can read even more about Bespoke All Access here.

Mar 24, 2023
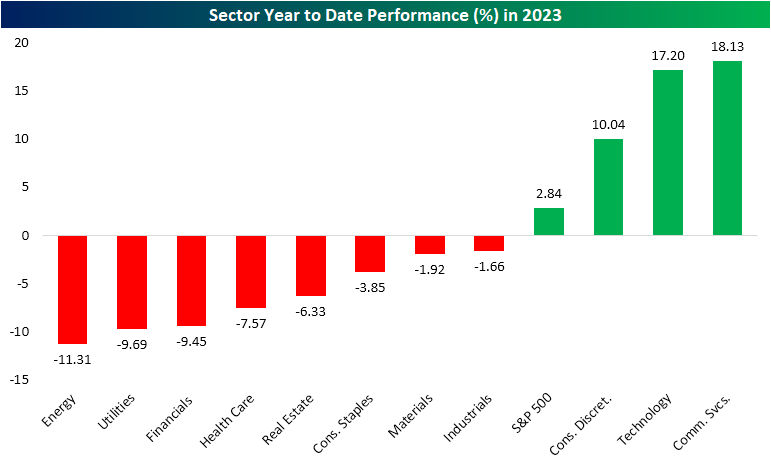
The first quarter of 2023 is coming to a close next week, and checking in on year to date performance, there has been a big divergence between the winners and losers. Although the S&P 500 is up 2.84% on the year as of yesterday’s close, only three of the eleven sectors are higher. Not only are those three sectors up on the year, but they have posted impressive double digit gains only three months into the year. Of those three, Consumer Discretionary has posted the smallest gain of 10% whereas Technology and Communication Services have risen 17.2% and 18.1%, respectively. The fact that these sectors are home to the main mega cap stocks — like Apple (AAPL), Amazon (AMZN), and Alphabet (GOOGL), which have been on an impressive run of late — helps to explain how the market cap weighted S&P 500 is up on the year without much in the way of healthy breadth on a sector level.

One thing that is particularly remarkable about this year’s sector performance is just how rare it is for a sector to be up 10%+ (let alone 3) while all other sectors are lower. And that is for any point of the year let alone in the first quarter. As we mentioned in yesterday’s Sector Snapshot and show in the charts below, going back to 1990, there have only been two other periods in which a sector has risen at least 10% YTD while all other sectors were lower YTD. The first of those was in May 2009. In a similar instance to now, Consumer Discretionary, Tech, and Materials were the three sectors with double digit gains back then. With those sectors up solidly, the S&P 500 was little changed on the year with a less than 1% gain. As you can see below, though, by the end of 2009, every sector had pushed into positive territory as the new bull market coming out of the global financial crisis was well underway.

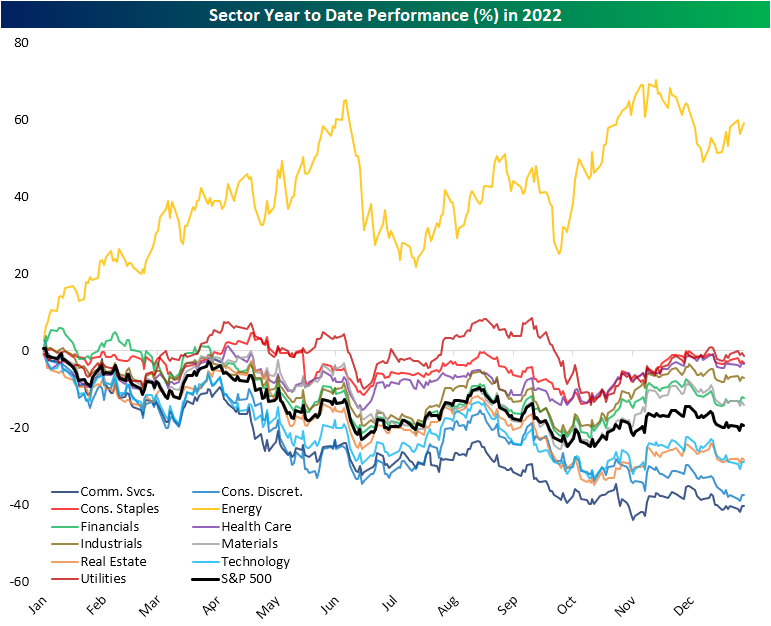
The next occurrence was much more recent: 2022. Obviously, it was a tough year for equities except for the Energy sector which had a banner year. Throughout most of the year, the sector traded up by well over 20% year to date even while the rest of the equity market was battered.
Have you tried Bespoke All Access yet?
Bespoke’s All Access research package is quick-hitting, actionable, and easily digestible. Bespoke’s unique data points and analysis help investors better visualize underlying market trends to ultimately make more informed investment decisions.
Our daily research consists of a pre-market note, a post-market note, and our Chart of the Day. These three daily reports are supplemented with additional research pieces covering ETFs and asset allocation trends, global macro analysis, earnings and conference call analysis, market breadth and internals, economic indicator databases, growth and dividend income stock baskets, and unique interactive trading tools.
Click here to sign up for a one-month trial to Bespoke All Access, or you can read even more about Bespoke All Access here.
Mar 23, 2023
Log-in here if you’re a member with access to the Closer.
Looking for deeper insight into markets? In tonight’s Closer sent to Bespoke Institutional clients, we start out with a look at the moves in 2 year yields and the drop in the US dollar and commodities (page 1). We follow up with a recap of the latest new home sales numbers (page 2) and how affordability has changed (page 3). Afterward, we update our Five Fed Manufacturing composite with the addition of the Kansas City Fed (page 4) before turning over to current account (page 5) and Fed balance sheet data (page 6). We finish with a review of today’s 10 year TIPS sale (page 7).

See today’s full post-market Closer and everything else Bespoke publishes by starting a 14-day trial to Bespoke Institutional today!
Mar 23, 2023
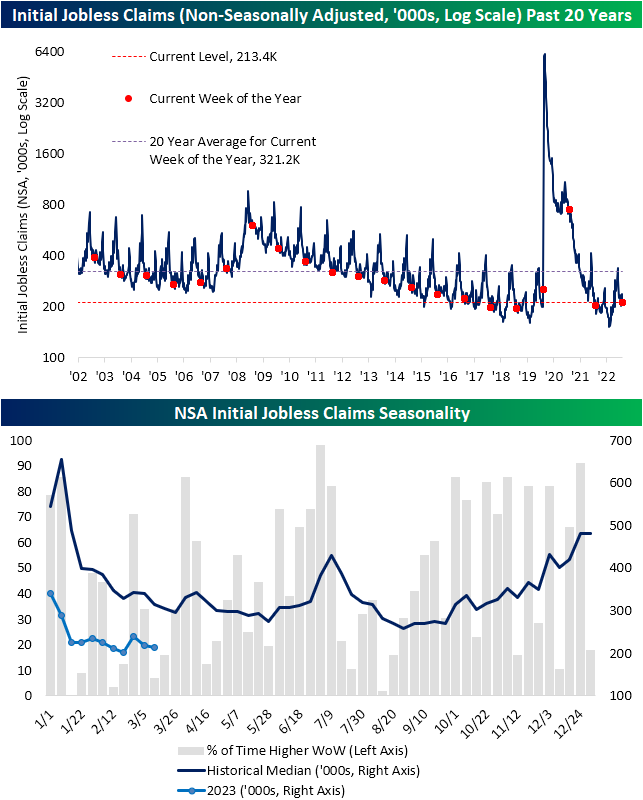
Initial jobless claims remained healthy this week with another sub-200K print. Claims fell modestly to 191K from last week’s unrevised reading of 192K. That small decline exceeded expectations of claims rising up to 197K. Given claims continue to impress, the seasonally adjusted number has come in below 200K for 9 of the last 10 weeks. By that measure, it has been the strongest stretch for claims since last April when there were 10 weeks in a row of sub-200K prints. Prior to that, from 2018 through 2020 the late March and early April period similarly saw consistent readings under 200K meaning that some of the strength in the adjusted number could be on account of residual seasonality.

In fact, this point of the year has some of the weeks in which claims have the most consistently historically fallen week over week. Taking a historical median of claims throughout the year, claims tend to round out a short-term bottom in the spring before an early summer bump. In other words, seasonal strength will begin to wane in the coming months.
While initial claims improved, continuing claims worsened rising to 1.694 million from 1.68 million the previous week. Albeit higher, that remains below the 2023 high of 1.715 million set at the end of February.

Have you tried Bespoke All Access yet?
Bespoke’s All Access research package is quick-hitting, actionable, and easily digestible. Bespoke’s unique data points and analysis help investors better visualize underlying market trends to ultimately make more informed investment decisions.
Our daily research consists of a pre-market note, a post-market note, and our Chart of the Day. These three daily reports are supplemented with additional research pieces covering ETFs and asset allocation trends, global macro analysis, earnings and conference call analysis, market breadth and internals, economic indicator databases, growth and dividend income stock baskets, and unique interactive trading tools.
Click here to sign up for a one-month trial to Bespoke All Access, or you can read even more about Bespoke All Access here.