Mar 27, 2023
Log-in here if you’re a member with access to the Closer.
Looking for deeper insight into markets? In tonight’s Closer sent to Bespoke Institutional clients, we begin looking at the correlation between bank stocks and the 2 year yield and WTI (page 1). We then take a look at equity performance based on state of domicile (page 2 and 3). We then turn over to the fourth update of our Five Fed manufacturing composite (page 4) before closing out with a recap of the weak 2 year note auction (page 5).

See today’s full post-market Closer and everything else Bespoke publishes by starting a 14-day trial to Bespoke Institutional today!
Mar 27, 2023
Although equities broadly are starting the new week higher, the most heavily shorted stocks are trading lower today. In the chart below, we show the relative strength of an index of the 100 most heavily shorted stocks versus the Russell 3,000 since January 2021 (the peak of the meme stock mania). Overall, the past couple of years since that period have consistently seen heavily shorted names underperform as seen through the downward trending line below. Although heavily shorted names saw some outperformance in January, they are making new lows.

On Friday, the latest short interest data as of mid-March was released by FINRA. Overall, there has not been too much of a change in short interest levels with the average reading on short interest as a percentage of float of Russell 3,000 stocks rising by 5 bps since the start of the year to 5.8%.
Prior to the changes to industry classifications that went into effect one week ago, the formerly labeled “retailing” industry consistently held the highest levels of short interest. Now, it is the Consumer Discretionary Distribution and Retail industry in the top spot with an average short interest level of 12.7%. That is up from 12.5% coming into the year and is multiple percentage points higher than the two next highest industries: Pharmaceuticals, Biotechnology & Life Sciences (9.36%) and Autos (9.18%). In spite of the recent bank closures, the banking industry actually has the lowest average levels of short interest. That being said, the latest data as of March 15th would have only accounted for a few days following the collapse of SVB. As such, the next release scheduled for April 12th with end-of-month data will provide a better read on the recent banking trouble’s impact on short interest levels.

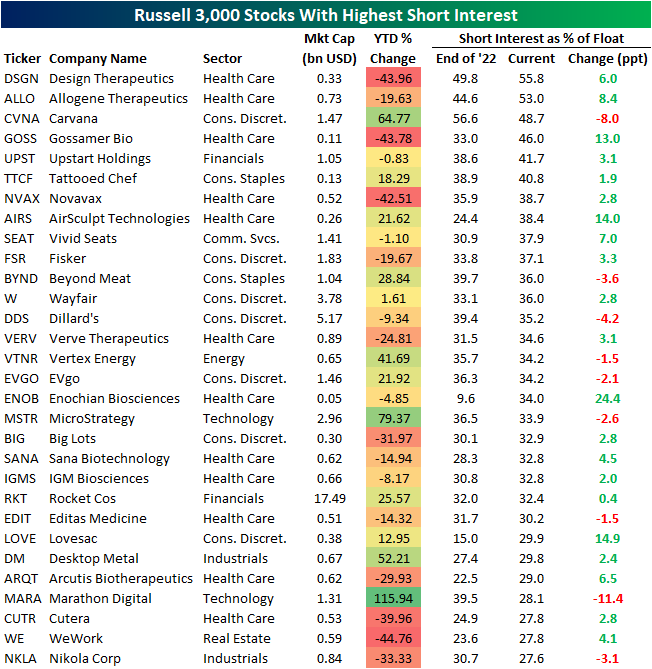
In the table below, we show the individual Russell 3,000 stocks with the highest levels of short interest as of the March 15th data. The sole two stocks with more than half of shares sold short are both Health Care names: Design Therapeutics (DSGN) and Allogene Therapeutics (ALLO). Both have seen short interest levels rise mid-single digits year to date. Other notables with high levels of short interest include some names that were briefly in vogue in recent years like Carvana (CVNA) and Beyond Meat (BYND). While short interest levels remain elevated, those are also two of the stocks listed below that have seen the largest declines in short interest this year which is likely due to solid appreciation in their stock prices. Only Marathon Digital (MARA) has seen a larger drop with its short interest level falling 11.4 percentage points since the end of last year after the stock more than doubled year to date. We would also note another crypto-related name, MicroStrategy (MSTR), is on the list and has been the second-best performer of the Russell 3,000 stocks with the highest short interest.
Have you tried Bespoke All Access yet?
Bespoke’s All Access research package is quick-hitting, actionable, and easily digestible. Bespoke’s unique data points and analysis help investors better visualize underlying market trends to ultimately make more informed investment decisions.
Our daily research consists of a pre-market note, a post-market note, and our Chart of the Day. These three daily reports are supplemented with additional research pieces covering ETFs and asset allocation trends, global macro analysis, earnings and conference call analysis, market breadth and internals, economic indicator databases, growth and dividend income stock baskets, and unique interactive trading tools.
Click here to sign up for a one-month trial to Bespoke All Access, or you can read even more about Bespoke All Access here.
