Sentiment: Back to the 20s

Whereas last week saw a huge rebound in bullish sentiment after the S&P 500’s breakout above March highs, the more listless price action of the past week resulted in a modest turnaround in sentiment. The latest AAII sentiment survey showed only 26.1% of respondents reported as bullish compared to the recent high of 33.3% last week.  The 7.2 percentage point decline was the largest one-week drop in bulls since the last week of February when it declined by 12.5 percentage points. That leaves bullish sentiment right in the middle of the range since the start of 2022.

Although bullish sentiment fell, without any considerable push lower for the S&P 500, bearish sentiment went little changed falling just half of one percentage point down to 34.5%. Like last week, that remains the lowest reading since the week of February 16th.

That means that all of the declines in bullish and bearish sentiment flowed to the neutral camp with a surge of 7.9 percentage points; the largest one-week increase since the first week of the year.  At 39.5%, neutral sentiment is at the high end of the past few years’ range and only 0.3 percentage points below the late February high.

The AAII survey was not the only sentiment reading to take a more bearish tone this week. The NAAIM Exposure index’s latest release today showed investment managers reduced equity exposure. Meanwhile, the Investors Intelligence survey’s bull-bear spread has actually continued to rise resulting in the highest reading since the first week of 2022.  Additionally, as we noted in Monday’s Chart of the Day, the TD Ameritrade Investor Movement Index went unchanged in March after rebounding in the proceeding few months.  In other words, across multiple readings, sentiment has improved but has yet to definitively shift to bullish.

Have you tried Bespoke All Access yet?

Bespoke’s All Access research package is quick-hitting, actionable, and easily digestible. Bespoke’s unique data points and analysis help investors better visualize underlying market trends to ultimately make more informed investment decisions.

Our daily research consists of a pre-market note, a post-market note, and our Chart of the Day. These three daily reports are supplemented with additional research pieces covering ETFs and asset allocation trends, global macro analysis, earnings and conference call analysis, market breadth and internals, economic indicator databases, growth and dividend income stock baskets, and unique interactive trading tools.

Click here to sign up for a one-month trial to Bespoke All Access, or you can read even more about Bespoke All Access here.

Claims Resume Their Trend Higher

Initial jobless claims were expected to tick higher this week with forecasts calling for a rise to 235K.  Instead, the increase was even more pronounced moving up to 239K from last week’s unrevised reading of 228K.  As we detailed last Thursday, the revisions to claims have resulted in a total shift in this indicator of the labor market.  After seasonal adjustment, claims are now definitively trending higher since the September low.

Before seasonal adjustment, claims were likewise higher week over week as could be expected given seasonal tendencies.  As shown below, the current week of the year has often seen claims rise. In fact, historically unadjusted claims have risen 85.7% of the time during the current week of the year. That is tied with three others (the weeks of approximately January 8th, October 1st, and November 5th) for the week of the year to most consistently see claims increase week over week.  Given that increase, levels this year are similar to those of the several years prior to the pandemic meaning that claims remain healthy before seasonal adjustment.

Whereas initial claims came in higher than expected, continuing claims actually were healthier.  Instead of the 10K increase penciled in by forecasters, continuing claims fell by 13K to 1.823 million.  Although in the short term that is a stronger-than-expected reading, continuing claims remain in an uptrend since the fall and are now at the high end of the range of readings that were common in the two years leading up to the pandemic.

Have you tried Bespoke All Access yet?

Bespoke’s All Access research package is quick-hitting, actionable, and easily digestible. Bespoke’s unique data points and analysis help investors better visualize underlying market trends to ultimately make more informed investment decisions.

Our daily research consists of a pre-market note, a post-market note, and our Chart of the Day. These three daily reports are supplemented with additional research pieces covering ETFs and asset allocation trends, global macro analysis, earnings and conference call analysis, market breadth and internals, economic indicator databases, growth and dividend income stock baskets, and unique interactive trading tools.

Click here to sign up for a one-month trial to Bespoke All Access, or you can read even more about Bespoke All Access here.

The Closer – Fed Recession Forecast, Transitioning to Lower Inflation – 4/12/23

Log-in here if you’re a member with access to the Closer.

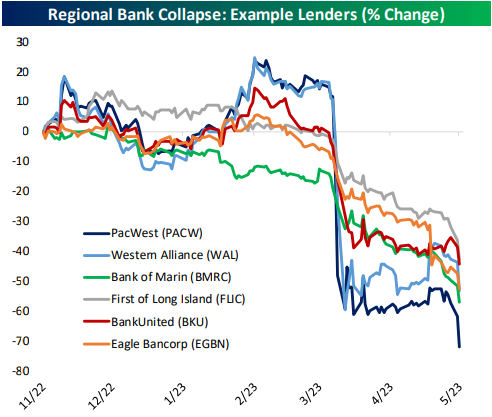
Looking for deeper insight into markets? In tonight’s Closer sent to Bespoke Institutional clients, we begin with commentary reviewing today’s FOMC meeting minutes (page 1) followed by a look into the latest CPI data (pages 2 and 3).  We then take a look at the latest EIA data (page 4) and 10 year note reopening (page 5).

See today’s full post-market Closer and everything else Bespoke publishes by starting a 14-day trial to Bespoke Institutional today!