Apr 29, 2026
Log-in here if you’re a member with access to the Closer.
- Hyperscaler capex continues to rise at an impressive rate of 80% YoY for the four mega-caps that reported earnings tonight.
- The FOMC rate decision had four dissents, an unusual level of discord not seen since 1992.
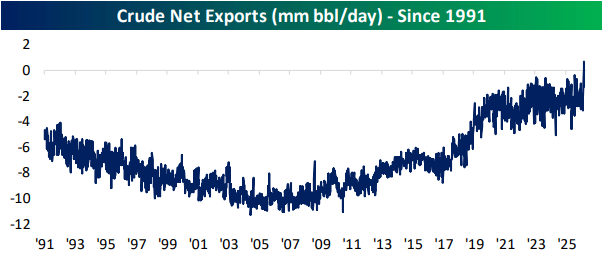
- There was a surplus in crude net exports for the first time on record last week.
See today’s full post-market Closer and everything else Bespoke publishes by starting a 14-day trial to Bespoke Institutional today!
Apr 29, 2026
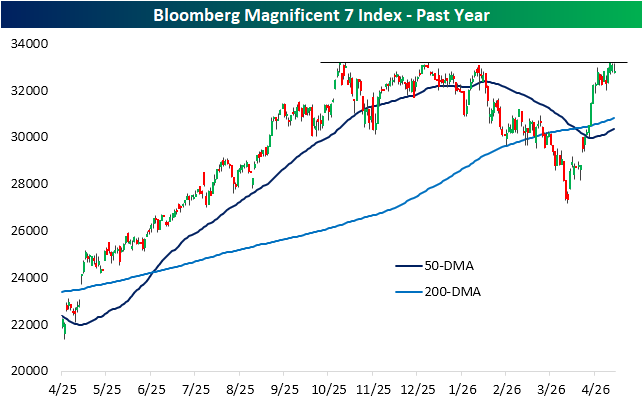
The market is anxiously awaiting the biggest news of the day, and it’s hard to argue that it’s the FOMC decision and Fed Chair Powell’s final meeting. Instead, the after-hours session of earnings is today’s huge event as reports from four of the seven Magnificent 7 members hit the tape: Amazon (AMZN), Alphabet (GOOGL), Meta (META), and Microsoft (MSFT). That is nearly $12 trillion in market cap, or 18.7% of the S&P 500’s total, reporting in one night.
Heading into quarterly results, this group has been on a solid run. Through today, Bloomberg’s equal-weight index tracking the Magnificent 7 members is up 20% versus the March 30th low. Given that rally, the index did in fact reach a new closing high on Monday, albeit that was only marginally above (3 bps) the previous peak on October 29th. As shown below, the lack of a meaningful breakout means the group is at an inflection point.
The MAG7 put in a triple top this past fall and early this year before the more prolonged selloff from late January through late last month. Considering the Magnificent 7 have hovered below those highs in the past couple of days, it is fair to say there has yet to be a meaningful breakout, and earnings will likely be a deciding factor in which way the chart breaks.
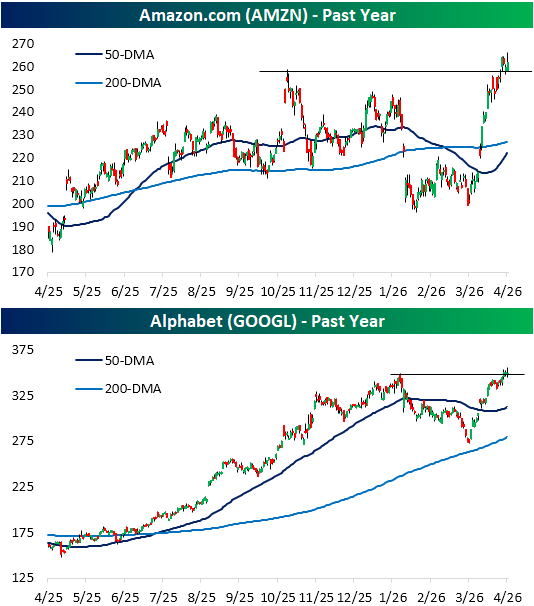
Looking under the hood, headed into earnings, the two strongest stocks among these names have been Amazon (AMZN) and Alphabet (GOOGL). As we noted in the Chart of the Day today, those two stocks are up 30.2% and 28.2%, respectively, over the past month. Perhaps more importantly, those rallies are resulting in 52-week highs. In AMZN’s case, the breakout has been more significant, but since the initial breakout last Friday, AMZN has pulled back to support at prior highs. GOOGL, on the other hand, has been in a tighter range over the past few days without the same clear breakout as AMZN saw.
Also, more insight into the performance of mega-cap stocks following big rallies into their earnings report, make sure to check out today’s Chart of the Day.
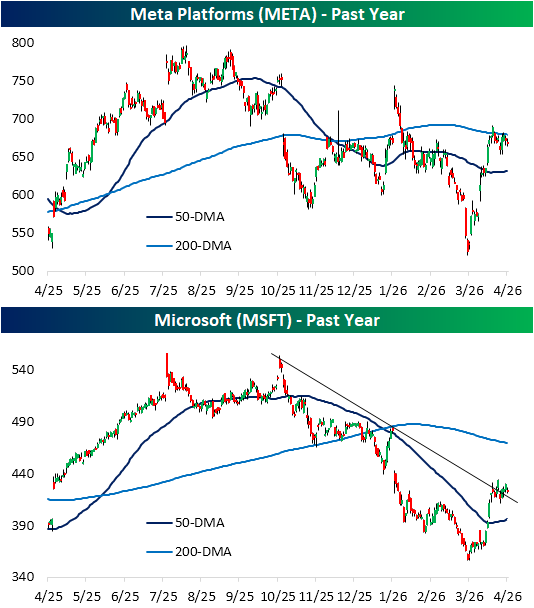
Shifting over to the other major reports tonight, the charts of META and MSFT have been two of the weaker ones among the mega caps. As shown below, META has been in a stubborn sideways trend over the past year, with the 200-DMA acting as tough resistance more recently. Meanwhile, MSFT has much further to go to reach its 200-DMA, leaving it in no-man’s land between its 50- and 200-DMA. With that said, the recent stall has occurred right at the downtrend line off of the past several months’ peaks.
In other words, good results on earnings tonight could mean clear 52-week highs for AMZN and GOOGL, a move above the 200-DMA for META, and a broken downtrend from MSFT.
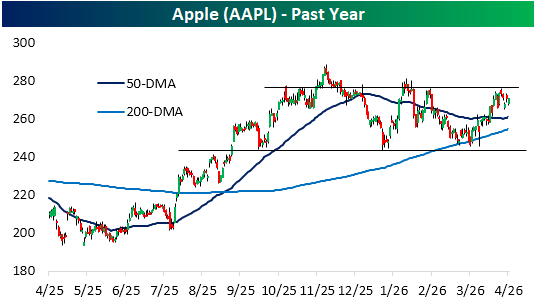
Following tonight’s reports, Apple (AAPL) will be the next mega-cap stock to watch as it reports tomorrow evening. As we noted in yesterday’s Wealth Management Report, AAPL has seen its relative strength go nowhere in the past few years. Paralleling that, the stock’s price has hardly gone anywhere in the past six months. As shown below, it is the most rangebound mega-cap name, although earnings come as it has made a run to the upper end of said range.
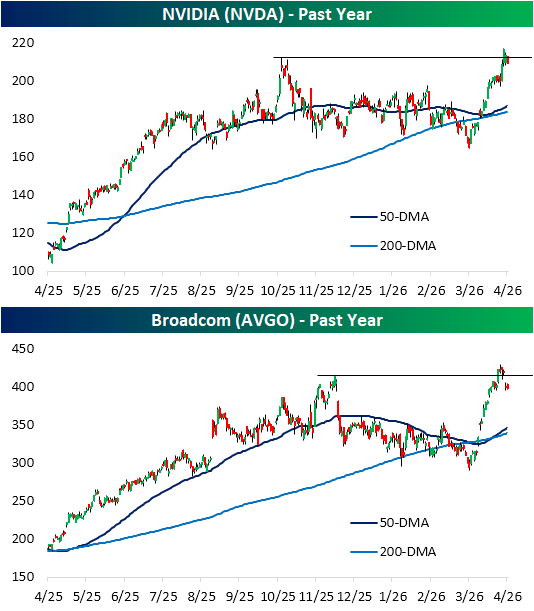
Finally, we would note that the next trillion-dollar market cap Tech stock to report after Apple will be NVIDIA (NVDA) at the end of earnings season. NVDA’s chart is more closely resembling the strength of GOOGL or AMZN, with a recent breakout sans meaningful follow-through.
Although it is not a Magnificent 7 member, the same could be said for another trillion-dollar semiconductor: Broadcom (AVGO). AVGO’s most recent report was in early March, with the next report slated for sometime in June. While the stock is up solidly since that prior report, its breakout almost appears to be a pump-fake with a sizable gap down below previous highs this week.
Like this analysis? Join our premium members by starting a trial today! Click below for details on how to sign up:

Apr 28, 2026
Log-in here if you’re a member with access to the Closer.
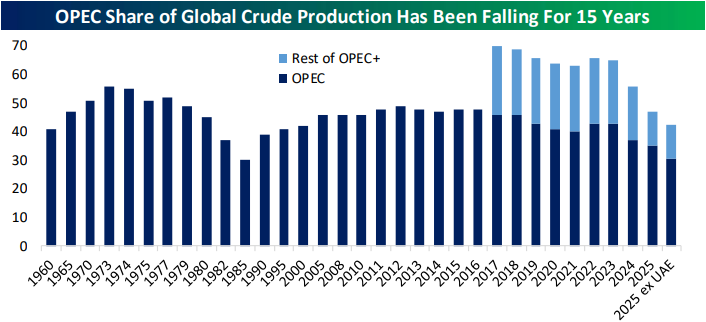
- The United Arab Emirates announced that they will be withdrawing from OPEC later this week; the U.A.E. is group’s third largest producer with the second largest spare capacity.
- The S&P 500 snapped a streak of four straight days of price and breadth moving in opposite directions.
- Conference Board and Case-Shiller data indicated housing activity has begun to bottom out.
See today’s full post-market Closer and everything else Bespoke publishes by starting a 14-day trial to Bespoke Institutional today!
Apr 27, 2026
Log-in here if you’re a member with access to the Closer.
- Morgan Stanley (MS) indices tracking political themes in the stock market have seen Democratic outperformance since Inauguration Day.
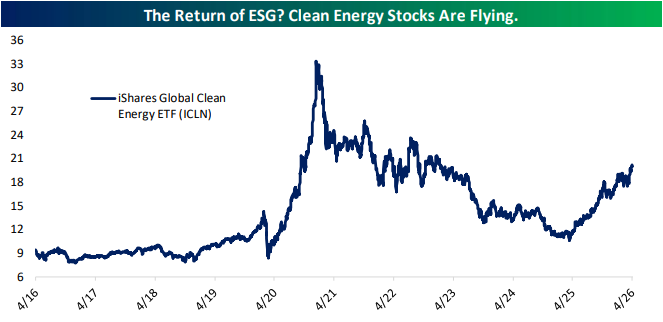
- Renewable energy stocks are trading at three-year highs after putting in a long term bottom last spring.
- 5-year Treasury auctions have tailed or priced at the screws at every auction over the past eleven months, tying all other coupons for the record streak of auctions without a stop through.
See today’s full post-market Closer and everything else Bespoke publishes by starting a 14-day trial to Bespoke Institutional today!