Profit Taking and Discount Shopping

We’re just five trading days into the second half of 2025, but so far this month, the average stock in the large-cap Russell 1,000 is up a solid 1.84%.  If you did well in the first half of the year, however, you’re likely seeing red, while those that lagged in the first half are finally seeing some green.

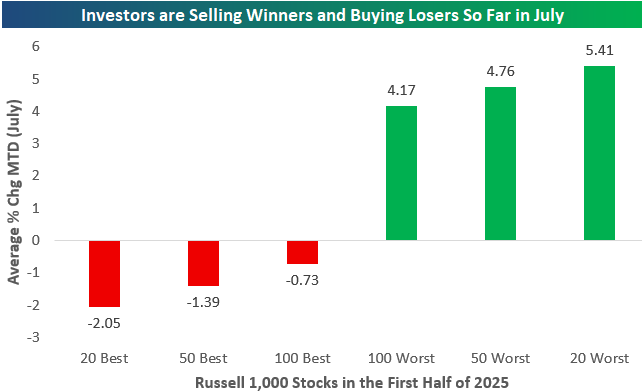
The chart below highlights a sharp reversal in investor behavior so far this month, with a clear rotation out of the first-half winners and into the biggest losers.  Looking at average month-to-date returns for Russell 1,000 stocks, the 20 best-performing names from the first half are down an average of 2.05%, while the top 50 and 100 from the first half are also in negative territory this month.  In contrast, the worst performers from the first half are seeing a surge in buying interest: the 20 worst names are up an average of 5.41% MTD, followed by the 50 worst at 4.76%, and the 100 worst at 4.17%.  This pattern reflects classic mean reversion trading, where investors rotate into beaten-down names in hopes of a rebound, while locking in profits on stocks that have already had big runs.  It also suggests that investors are bottom-fishing in laggards in search for value or speculative bounce plays.  Whether this is a short-term rebalancing or the start of a more sustained shift in market leadership remains to be seen, but it’s interesting that we saw similar pullbacks in first-half market leaders in July 2023 and July 2024 as well.

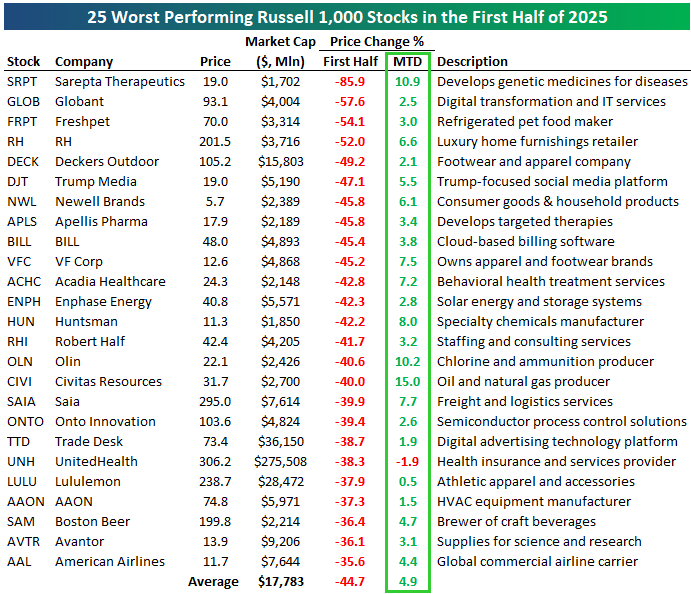
Of the 25 worst-performing Russell 1,000 stocks in the first half, all but one are up so far this month.  On average, these stocks fell 44.7% in the first half, and they’re up 4.9% already in the first five trading days of July.

Take a look at the first-half losers below, of which you’ll likely be familiar with most.

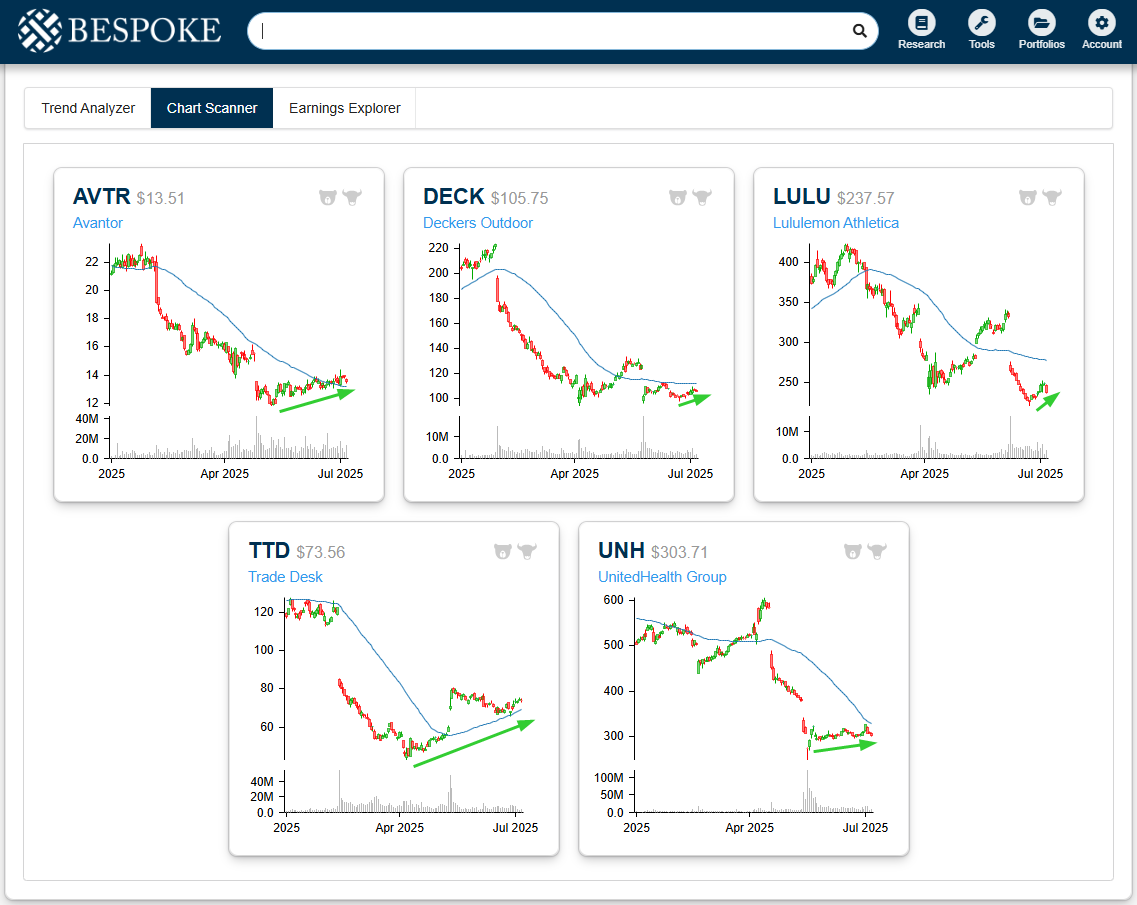
Below are price charts of the five biggest stocks on the list of first-half losers shown above: Avantor (AVTR), Deckers Outdoor (DECK), Lululemon (LULU), Trade Desk (TTD), and UnitedHealth (UNH).  All five fell off a cliff at some point in the first half, but they’re currently attempting to round out a bottom.  Trade Desk (TTD) has been trying to turn things around for the longest, as it bottomed back in April and now has a rising 50-day moving average again.

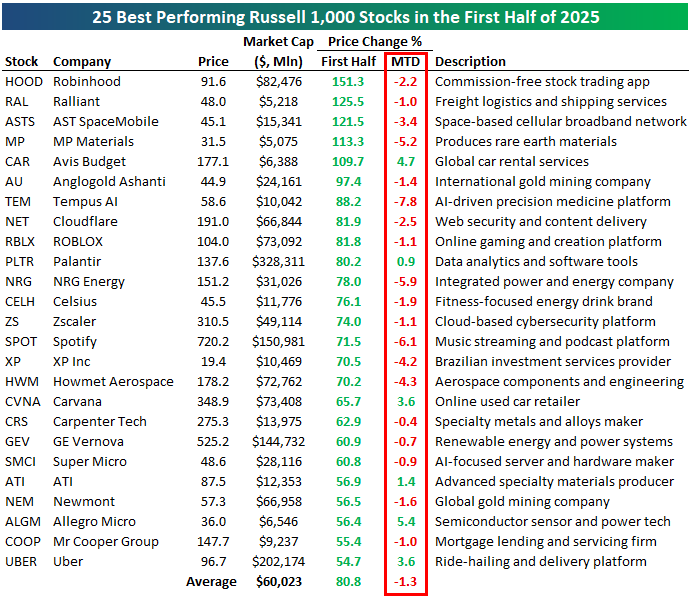
Of the 25 best performers in the first half, only six are in the green so far this month: CAR, PLTR, CVNA, ATI, ALGM, and UBER.  On average, these stocks, which all gained at least 50% in the first half, are down 1.3% month-to-date.  None are down more than 8%, though, so the selling hasn’t been that extreme.

With earnings season on the horizon, maybe some investors are cashing in on high-beta winners to try and avoid earnings blow-ups.

Bespoke’s Consumer Pulse Report — July 2025

Bespoke’s Consumer Pulse Report is an analysis of a huge consumer survey that we run each month.  Our goal with this survey is to track trends across the economic and financial landscape in the US.  Using the results from our proprietary monthly survey, we dissect and analyze all of the data and publish the Consumer Pulse Report, which we sell access to on a subscription basis.  Sign up for a 30-day free trial to our Bespoke Consumer Pulse subscription service.  With a trial, you’ll get coverage of consumer electronics, social media, streaming media, retail, autos, and much more.  The report also has numerous proprietary US economic data points that are extremely timely and useful for investors.

We’ve just released our most recent monthly report to Pulse subscribers, and it’s definitely worth the read if you’re curious about the health of the consumer in the current market environment.  Start a 30-day free trial for a full breakdown of all of our proprietary Pulse economic indicators.

The Bespoke Report – Equity Market Pros and Cons – Q3 2025

This week’s Bespoke Report is an updated version of our “Pros and Cons” edition for Q3 2025.

With this report, you’re able to get a complete picture of the bull and bear case for US stocks right now.  It’s heavy on graphics and light on text, but we let the charts and tables do the talking!

On page three of the report, you’ll see a full list of the pros and cons that we lay out.  Slides for each topic are then provided on page four and beyond.

To read this report and access everything else Bespoke’s research platform has to offer, sign up for Bespoke’s 50/20 special today.  Our 50/20 special gets you a full year of Premium for half off, then 20% off per month after the first year.  SIGN UP HERE.

Below is a look at the performance of key ETFs across asset classes so far in Q2 and year-to-date.

After a very rough March and early April, equities both domestically and globally have surged since.  The S&P 500 (SPY) is currently up more than 10% in Q2 with just one full trading day left on Monday.  The Tech-heavy Nasdaq 100 (QQQ) is up much more at 17.4%, while the Semis (SMH) are up more than 30%.

As good as it has been in the US, it has been an even better first half and second quarter for much of the rest of the world.  The All World ex US ETF (CWI) is up 18.5% on the year versus a gain of 5.7% for the US (SPY), and countries like Germany (EWG), Italy (EWI), Mexico (EWW), and Spain (EWP) are sitting on 30%+ YTD gains.

As a reminder, quarterly rallies this strong aren’t the norm, so enjoy it but don’t get too cocky heading into Q3.  Mr. Market loves serving humble pie to the face of investors that think they have it all figured out.