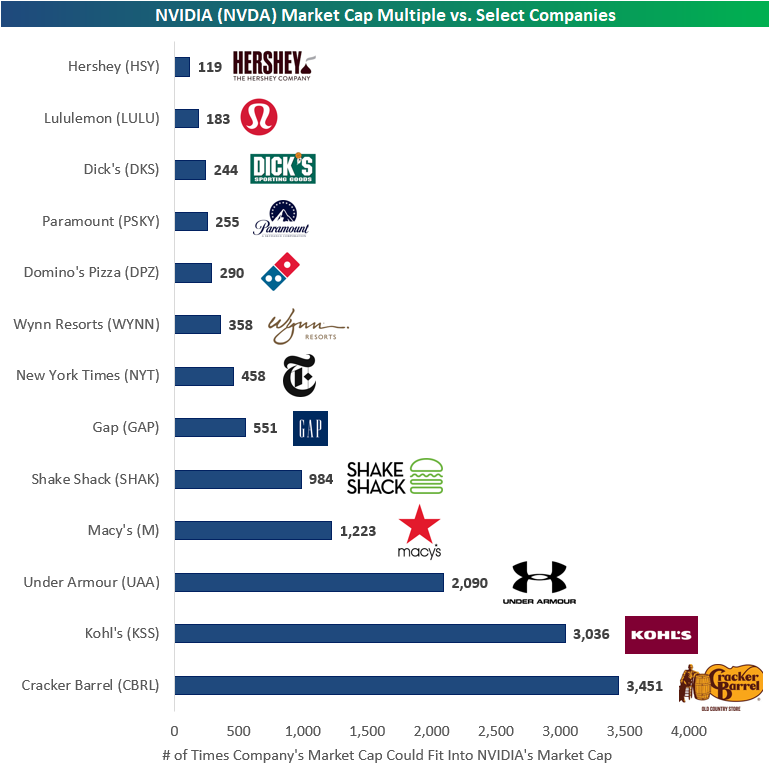
The Bespoke Report – Rotation – 9/5/25
To read our weekly Bespoke Report newsletter and access everything else Bespoke’s research platform offers, start a two-week trial to Bespoke Premium.
The tape has been heavy for growth stocks for a few weeks now, especially AI names, but that hasn’t stopped investors from rotating into other areas of the market that had been doing poorly up until mid-August. Read our thoughts on recent market action and where we might go from here in this week’s report.

Best and Worst Country ETFs Since Trump 2.0
If you missed Bespoke’s Paul Hickey on CNBC this morning, click here to watch the clip.
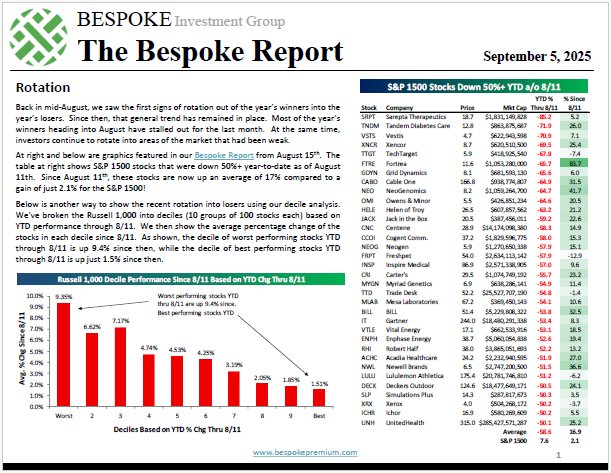
It has been 225 days since President Trump’s Inauguration on January 20th, and the S&P 500 (SPY) entered today up 8% since the last close before the Inauguration. That ranks 35th out of 45 country stock market ETFs we track closely. With a gain of 20.4%, the average country ETF shown in the table below is up much more than the US (SPY) since Trump 2.0 began. Greece (GREK), Vietnam (VNAM), and Spain (EWP) are up the most at 50%+, while Italy (EWI) has been the best performing G7 country at +35.2%. Speaking of the G7, the US has been the worst market among these seven developed nations since Inauguration Day in January.
In addition to post-Inauguration Day performance, we also show how each country ETF performed since global equity markets made their post-tariff crash lows on April 8th. The US (SPY) has posted much more respectable returns relative to the rest of the world; up 29.9% versus the average of 27.9%. Of the G7, only Italy (EWI) and Canada (EWC) are up more than the US (SPY) since April 8th, while France (EWQ) has lagged the most of this group with a gain of 19.5%.
Along with being the second-best-performing country ETF since Inauguration Day, Vietnam (VNAM) has easily been the best performer since April 8th with a gain of 77.5%. On the flip side, Saudi Arabia (KSA) is the only country ETF that is down over both periods (-10.9% since 1/20, -2.1% since 4/8). Argentina (ARGT) and Indonesia (EIDO) are two others that are now solidly red since 1/20, while India (INDA) is up just 1.6% since 1/20 and 5.7% since 4/8 (second worst).

US ETF Growth Easily Outpaces Market Gains Since 2020
With the recent news that there are now more ETFs than stocks in the US, we wanted to provide an update on the dollar amounts that have flowed into ETFs so far this decade.
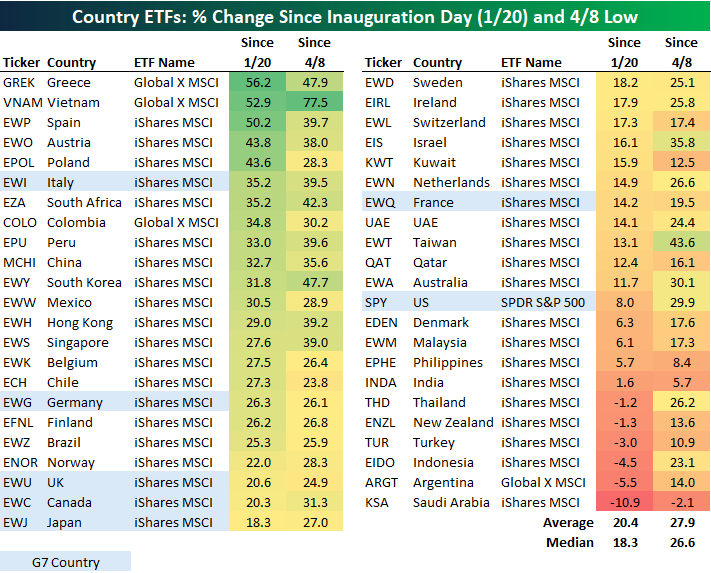
Since the end of 2019, exchange-traded products (ETPs) in the U.S. — primarily ETFs — have exploded in size, outpacing even the impressive rise of the S&P 500.
The first chart below highlights just how powerful the trend has been: while the S&P 500’s total return has surged about +120% since the start of 2020, US ETF assets under management (AUM) have climbed an even steeper +177%. That gap shows that ETFs have not just grown alongside the market; they’ve attracted a massive wave of fresh capital from investors seeking low-cost, diversified, and flexible investment vehicles.
The second chart below underscores this growth in dollar terms. According to Bloomberg, U.S. ETF assets have ballooned from around $4 trillion at the start of 2020 to a record $12.3 trillion today. While markets have had their ups and downs over the past five years, the long-term trajectory of ETF adoption has been relentlessly upward. This expansion is being fueled not only by equity gains but also by the sheer volume of new inflows, as investors of all sizes, retail to institutional, continue to shift from mutual funds and other structures into ETFs. Put simply, ETFs are no longer a niche product…they are the market. With their assets now equal to more than half of U.S. GDP, their influence on trading flows, liquidity, and even market structure will only grow. And with ETF growth running far ahead of the broader equity market, this wave of adoption shows no sign of slowing down.
NVIDIA (NVDA) is How Big??
The largest company in the world — NVIDIA (NVDA) — reported quarterly earnings on Wednesday (8/27) after the close, and you can read our review of NVDA’s conference call here if you’re interested.
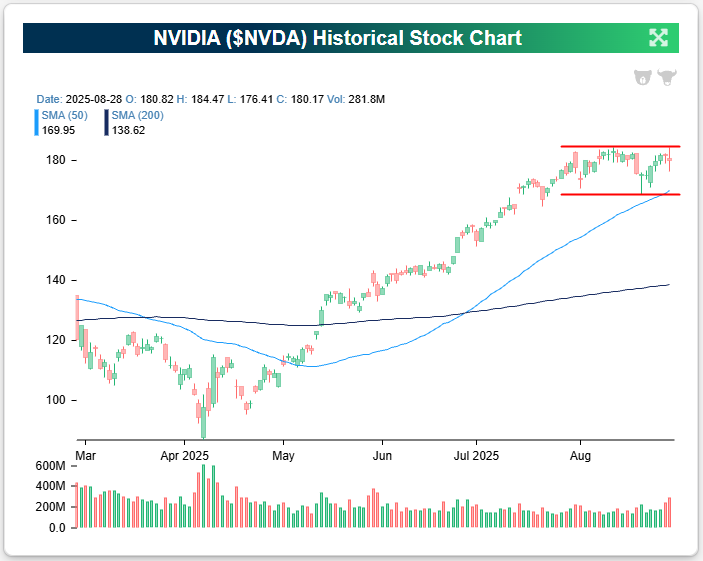
While NVIDIA (NVDA) has historically averaged a one-day change of nearly +/-8% following earnings, its reaction to this quarter’s report was a decline of less than 1%. As you can see in the chart below, bulls went into NVDA earnings hoping the stock would break out to new highs after a period of sideways action since mid-July. That breakout has yet to materialize, though, and today we’re seeing shares head lower by 2-3% again. For now, new highs for NVDA appear to be on hold.
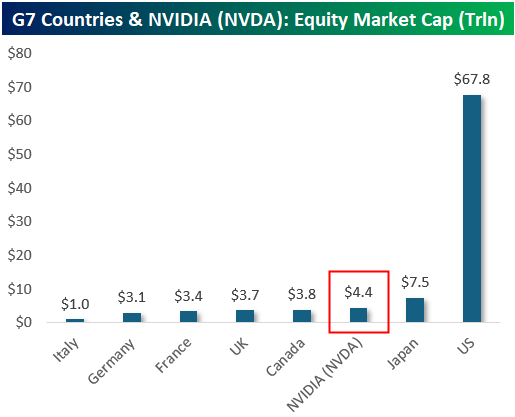
Below are a few charts that highlight just how gigantic NVIDIA (NVDA) has become. The first stacks NVDA’s market cap against the world’s largest economies. At $4.4 trillion, NVIDIA is now bigger than the entire equity markets of five of the seven G7 countries—Italy, Germany, France, the U.K., and Canada. Japan is the only non-US country in the G7 with a larger market cap. That means one U.S. company, riding the AI wave, is worth more than the combined value of every publicly traded company in several of the world’s most advanced economies.
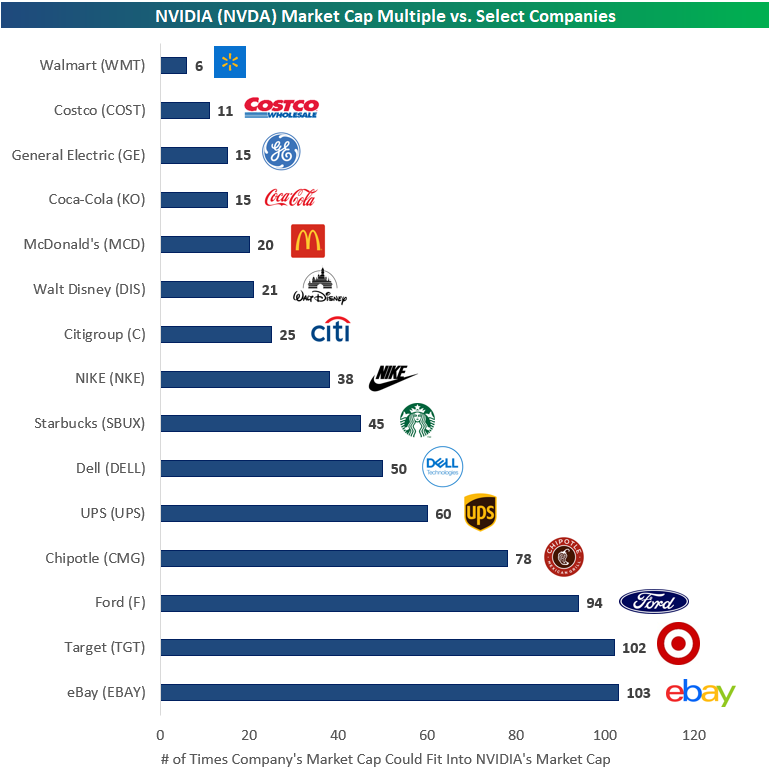
If you thought comparing NVIDIA to entire countries was wild, our next chart shows just how far ahead it is of some of America’s most iconic companies. With a market cap north of $4 trillion, NVIDIA is worth 6 Walmarts (WMT), 11 Costcos (COST), 20 McDonald’s (MCD), or 25 Citigroups (C). Taking it further, it could swallow 38 Nikes (NKE), 45 Starbucks (SBUX), or 50 Dells (DELL). At the extreme end, NVIDIA’s value equals about 60 UPS (UPS), 78 Chipotles (CMG), 94 Fords (F), 102 Targets (TGT), or 103 eBays (EBAY). Put simply, NVIDIA’s market cap isn’t just massive, it’s in a league of its own, making even household corporate giants look like small caps by comparison.
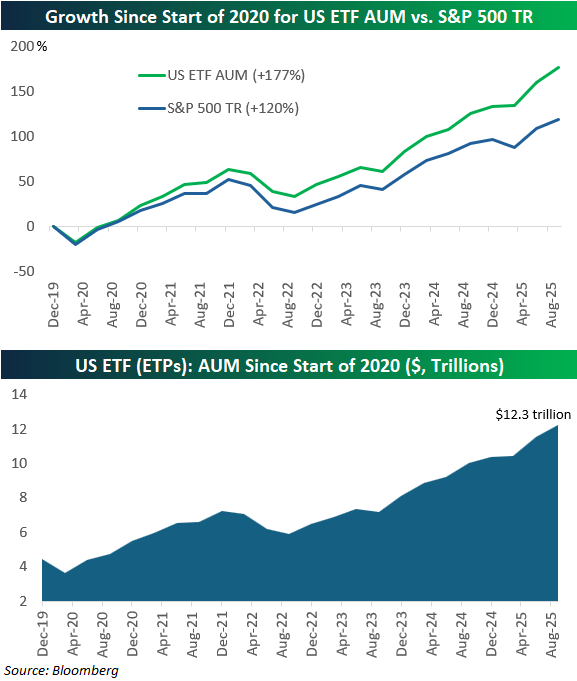
Our last chart pushes the point even further: NVIDIA’s market cap doesn’t just dwarf corporate icons, it makes many popular consumer brands look minuscule. At today’s size, NVIDIA is worth the same as 119 Hersheys (HSY), 183 Lululemons (LULU), or 244 Dick’s Sporting Goods (DKS). It could equal 290 Domino’s (DPZ), 358 Wynn Resorts (WYNN), or 458 New York Times (NYT). Stretch it further, and you get jaw-dropping multiples: 551 Gaps (GAP), 984 Shake Shacks (SHAK), 1,223 Macy’s (M), 2,090 Under Armours (UAA), 3,036 Kohl’s (KSS), or an incredible 3,451 Cracker Barrels (CBRL). When one company is worth thousands of other recognizable brands outright, it underscores just how unprecedented NVIDIA’s dominance has become.