Jul 18, 2025
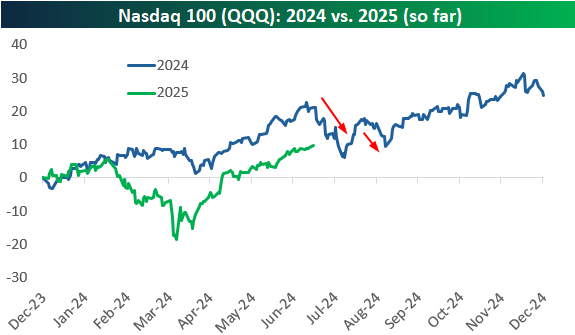
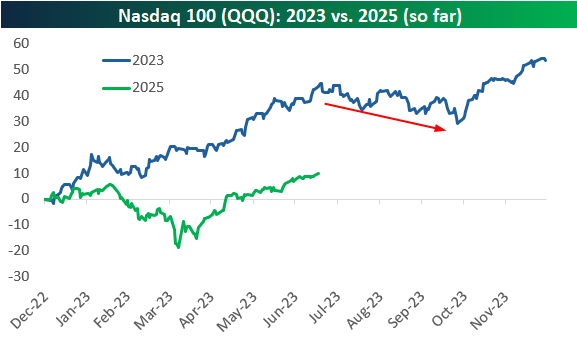
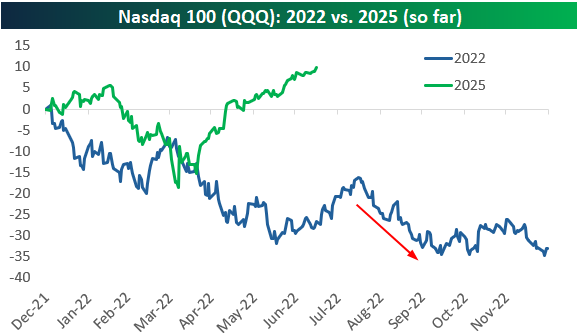
The mega-cap Tech-heavy Nasdaq 100 (QQQ) was sitting on a year-to-date gain of 10% through 2025’s first 134 trading days (through 7/17).
In the charts below, we compare QQQ’s action so far in 2025 to every other year so far this decade. Notably, throughout the 2020s, we’ve seen quite a few sell-offs at some point in Q3, with declines beginning in late July in each of the last two years.
At this point in 2024, QQQ was up 21% year-to-date, or more than twice the 10% gain it has this year. But last year, we also saw a nasty drop that began in mid-July just as the Q2 earnings season was getting started and the 2024 Presidential Election started to ramp up. President Biden getting replaced by VP Harris, and the assassination attempt on President Trump increased market volatility, but QQQ eventually resolved higher by the time September rolled around.
In 2023, QQQ was up a huge 43.7% year-to-date as of July 17th as investors clamored for AI stocks after ChatGPT was released in late 2022. QQQ would end up peaking on July 19th, however, and it went on to fall 10% from that point through its low in late October 2023. We then saw a surge in the final two months of the year for a full-year gain of more than 50% for QQQ in 2023.
Things were dark at this point in 2022. ChatGPT still wasn’t a thing in July 2022, and the Nasdaq 100 (QQQ) was down 26.6% year-to-date at the time. The chart of QQQ this year looked somewhat similar to 2022 through April at least, but from there, the similarities end.
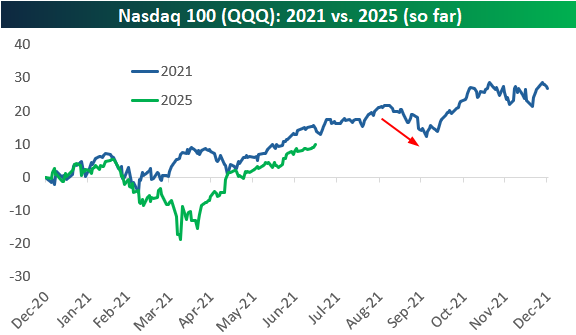
At this point in 2021, COVID was still “a thing” for most investors, but we were also in the midst of a crypto and meme-stock boom that would last through the end of 2021. While QQQ didn’t run into trouble in July or August of 2021, it stumbled a bit in September as rising inflation and “bubble-like” action in stocks really came into view.
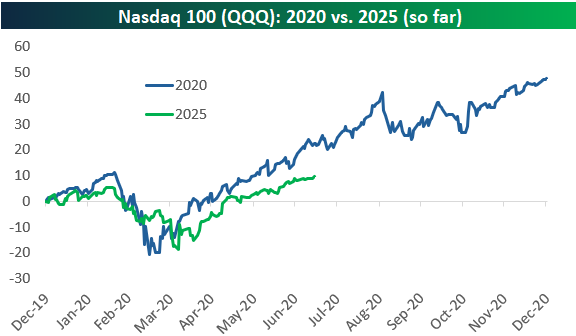
Finally, we get to 2020. So far at least, 2025 looks most similar to 2020 for QQQ, as the COVID Crash of 2020 and the Tariff Crash of 2025 saw remarkably similar action. If the 2020 pattern continues to track, we’ve got more room to run for a couple more months before some weakness in the fall, followed by a rally during the two-month holiday stretch to end the year.
As always, past performance is not indicative of future results, but we find it fascinating how similar some years look with others, as well as some of the seasonal trends that seem to always show up.

Jul 18, 2025
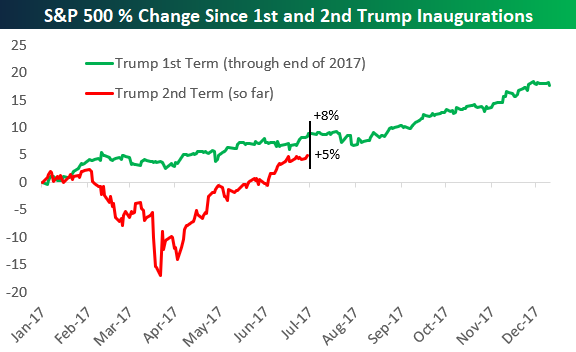
Back on April 8th, the S&P 500 was down 16.9% in the 55 trading days since Inauguration Day on January 20th, but as shown below, the index has recovered all of its initial losses and is currently up 5% since President Trump re-took office. What a comeback!
At this point in Trump’s first term back in July 2017, the S&P was sitting on a gain of 8% since Inauguration Day.
Back in 2017, we saw stocks pull back a bit in August but then explode higher from September through December, and the S&P ended up posting a gain of 18% from Inauguration Day 2017 through the end of that year. We’ll have to wait and see what the rest of 2025 has in store, but either way, the market has seen an absolutely remarkable comeback from the depths of the Tariff Crash just a few months ago.
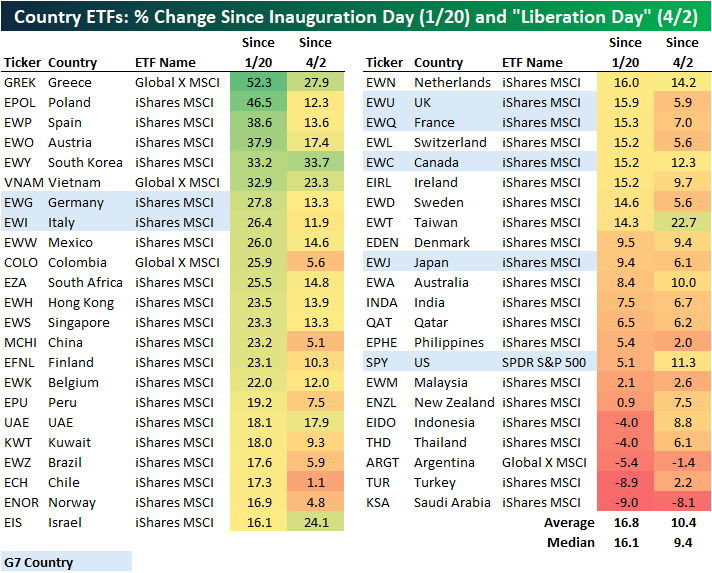
Even with the S&P back to new highs and up 5% since Trump’s 2nd term began, the US is near the bottom of the pack in terms of country by country stock market performance since Inauguration Day. Below is an updated look at the performance of 45 country ETFs traded on US exchanges since Inauguration Day as well as since Trump’s “Liberation Day” tariff announcements in the White House Rose Garden on April 2nd.
The average country ETF is up 16.8% since Trump re-took office, so the US (SPY) is underperforming that average by more than ten percentage points. The US is also still the worst performing of the G7 country ETFs since Inauguration Day, although it’s up the fourth most of the G7 countries since April 2nd.
There are six country ETFs that are up 30%+ since Inauguration Day back in January: Greece (GREK), Poland (EPOL), Spain (EWP), Austria (EWO), South Korea (EWY), and Vietnam (VNAM). On the other end of the spectrum, there are five country ETFs in the red since Inauguration Day: Indonesia (EIDO), Thailand (THD), Argentina (ARGT), Turkey (TUR), and Saudi Arabia (KSA).
Jul 17, 2025
See what’s driving market performance around the world in today’s Morning Lineup. Bespoke’s Morning Lineup is the best way to start your trading day. Read it now by starting a two-week trial to Bespoke Premium. CLICK HERE to learn more and start your trial.
“All money is a matter of belief.” – Adam Smith
Often hailed as the father of modern economics, Adam Smith (who died on this day in 1790) profoundly shaped our understanding of free markets and individual liberty through his seminal works, The Wealth of Nations and The Theory of Moral Sentiments. His ideas on the “invisible hand” and division of labor remain foundational to economic theory, emphasizing how self-interest and cooperation drive prosperity.

Below is a snippet of commentary from today’s Morning Lineup. Start a two-week trial to Bespoke Premium to view the full report.
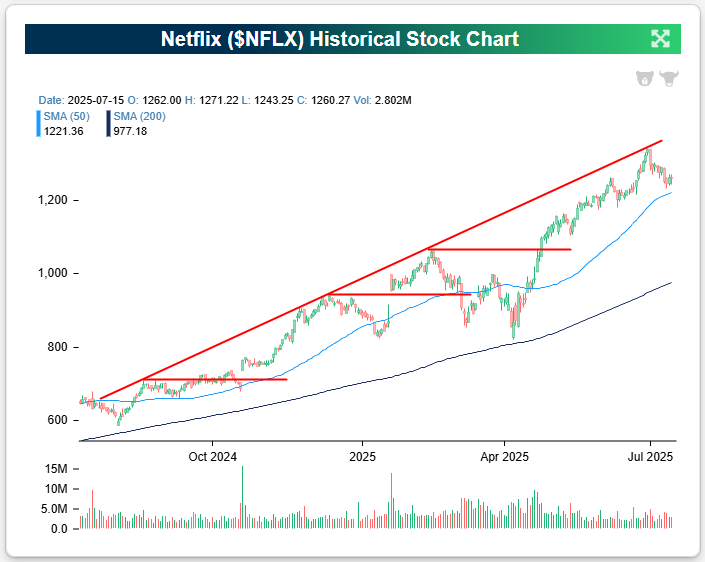
The banks and brokers always kick off each earnings season, but Netflix (NFLX) is the company that gets things started on the Tech/Consumer side of things. As shown below, NFLX is heading into its Q2 earnings report tonight in a long-term uptrend, but it has pulled back some in the past couple of weeks after touching up against the top of its one-year uptrend channel at the end of June. At the moment, it’s sitting just above support at its 50-day moving average after working off overbought levels.
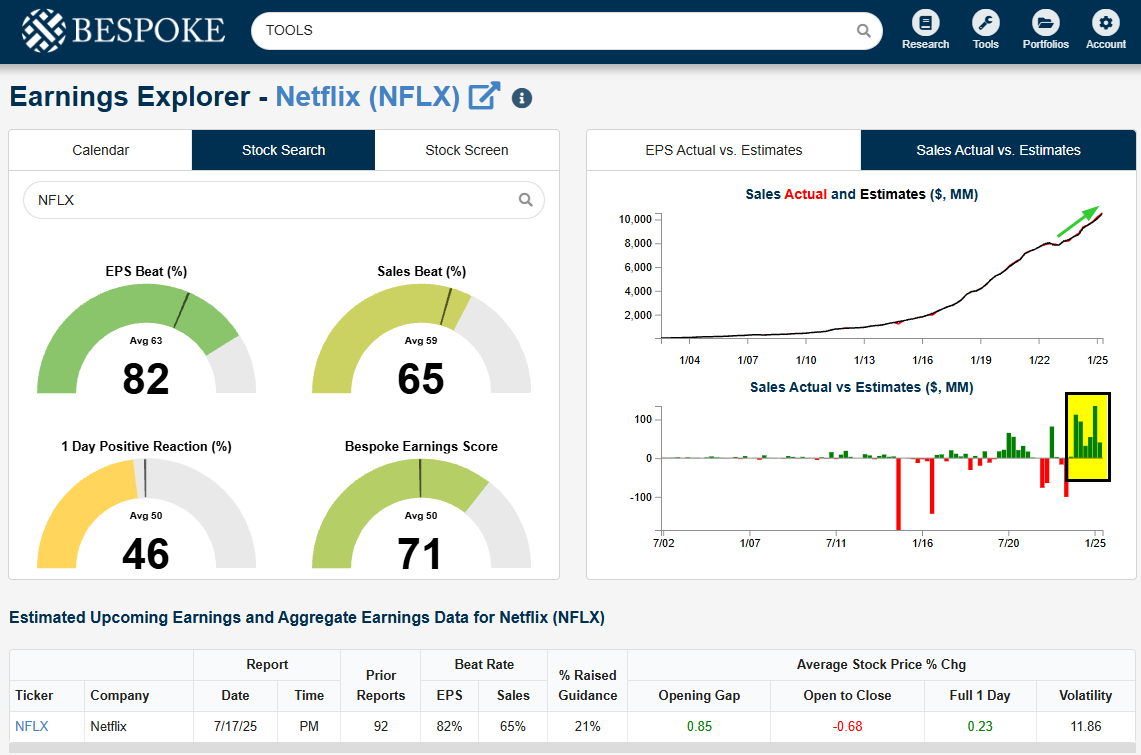
Below is a snapshot of Netflix (NFLX) from our Earnings Explorer tool, which can be seen on our website here for those with access (Institutional only). After stumbling on sales a few years ago in 2022, NFLX has seen a revenue resurgence with strong beats versus top-line estimates for six straight quarters. If estimates are met, this will be the third straight $10+ billion quarter for NFLX and the first above $11 billion.
There is some negative historical precedent for Netflix’s Q2 earnings reports specifically, though…
Jul 16, 2025
This content is for members only
Jul 16, 2025
See what’s driving market performance around the world in today’s Morning Lineup. Bespoke’s Morning Lineup is the best way to start your trading day. Read it now by starting a two-week trial to Bespoke Premium. CLICK HERE to learn more and start your trial.
“There is always some kid who may be seeing me for the first time. I owe him my best.” – Joe DiMaggio
On this day in 1941, Yankees star Joe DiMaggio extended his record hit streak to 56 games, which would end the next day. July 16th was also the day of the first atomic bomb test in New Mexico in 1945. J.D. Salinger’s Catcher in the Rye was published on July 16th, 1951, and the Apollo 11 moon-landing mission launched on this day in 1969.
Below is a snippet of commentary from today’s Morning Lineup. Start a two-week trial to Bespoke Premium to view the full report.
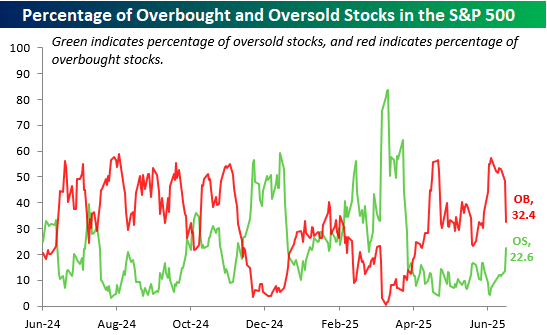
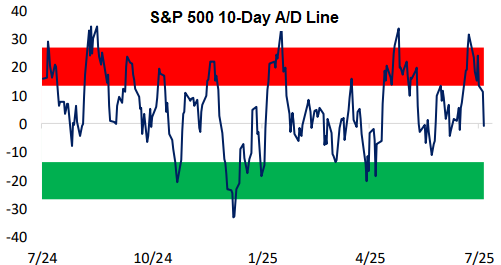
While the S&P is down just 0.3% over the last week, we’ve seen overbought levels work themselves off for some of the key breadth levels we watch.
The S&P’s 10-day advance/decline line had gotten to one of its most overbought levels of the last year earlier in the month, but it’s currently sitting just below the flat-line.
The percentage of overbought stocks in the S&P has also fallen from a reading above 50% down to 32%, while 22.6% of stocks in the index are now oversold.