Oct 15, 2025
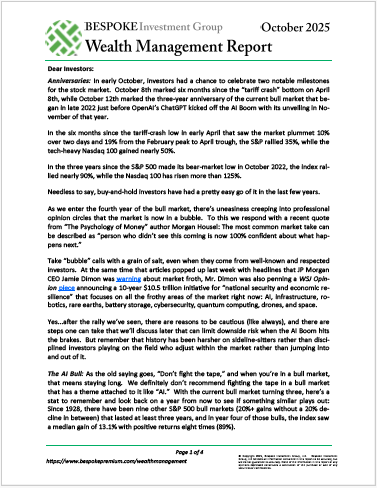
Please click here or on the link below to read our latest quarterly Wealth Management Report. You can learn more about Bespoke’s wealth management services available to investors here or by calling our office at 914-315-1248.
Below are links to prior quarterly Wealth Management Reports:
Bespoke WMR Q2 2025
Bespoke WMR Q1 2025
Bespoke WMR Q4 2024
Oct 13, 2025
The Q3 earnings season will begin in earnest tomorrow morning with four big banks and brokers set to report ahead of the open.
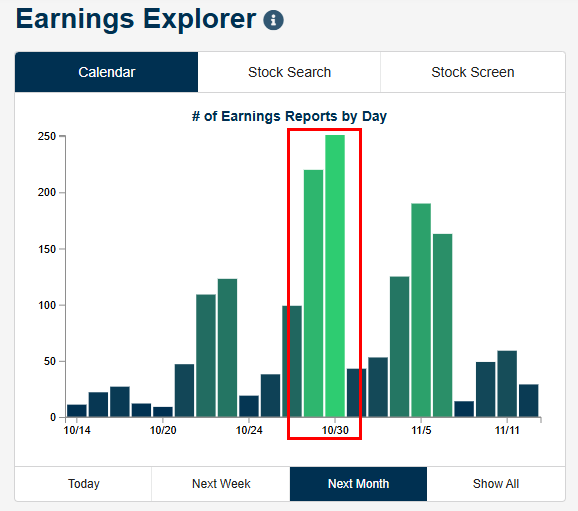
As the snapshot below from our useful Earnings Explorer tool shows, though, the peak of earnings season is still a couple of weeks away later this month. This quarter’s biggest day for earnings will be Thursday, October 30th, when roughly 250 companies will report Q3 numbers.
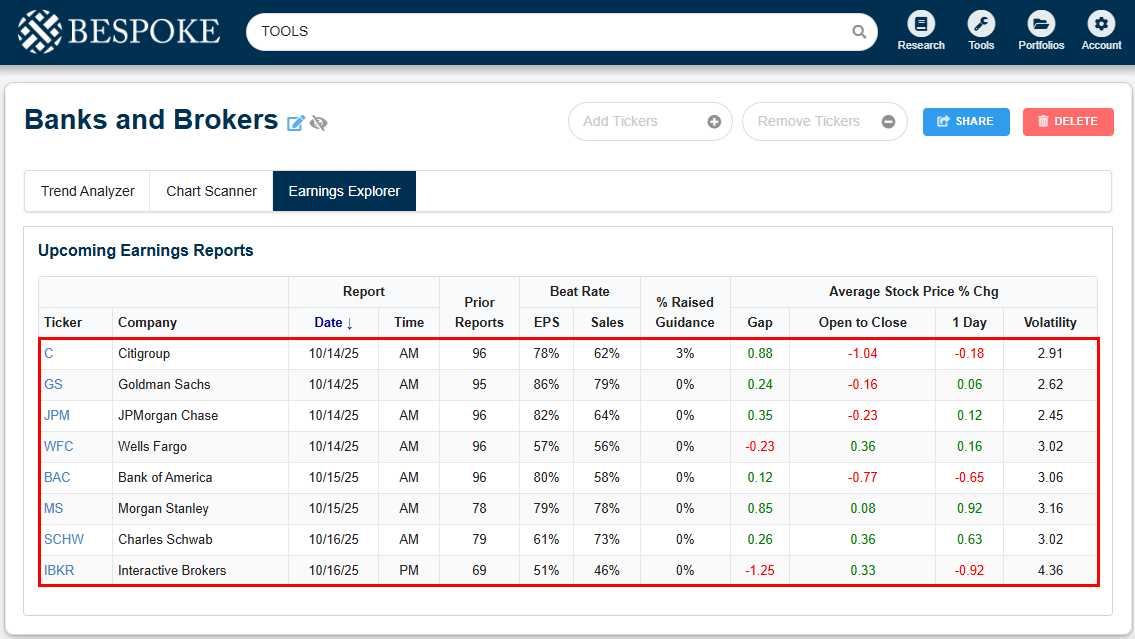
Eight big banks and brokers will report Q3 numbers in the next few days. We created a custom portfolio — just like subscribers can do — that includes each of these eight stocks so that we can take a closer look at them.
Starting with earnings, tomorrow morning we’ll hear from Citigroup (C), Goldman Sachs (GS), JP Morgan (JPM), and Wells Fargo (WFC). Of these four stocks, Goldman has the strongest “beat” rates, while Wells Fargo has the weakest. (A stock’s beat rate represents the percentage of the time it has beaten consensus analyst estimates.)
Bank of America (BAC) and Morgan Stanley (MS) will then report on Wednesday morning, while Charles Schwab (SCHW) and Interactive Brokers (IBKR) will report on Thursday.
In terms of share price reactions to earnings, Morgan Stanley (MS) is the name that has historically averaged the biggest gains on its earnings reaction days. IBKR has averaged the biggest declines and been the most volatile of the names listed.
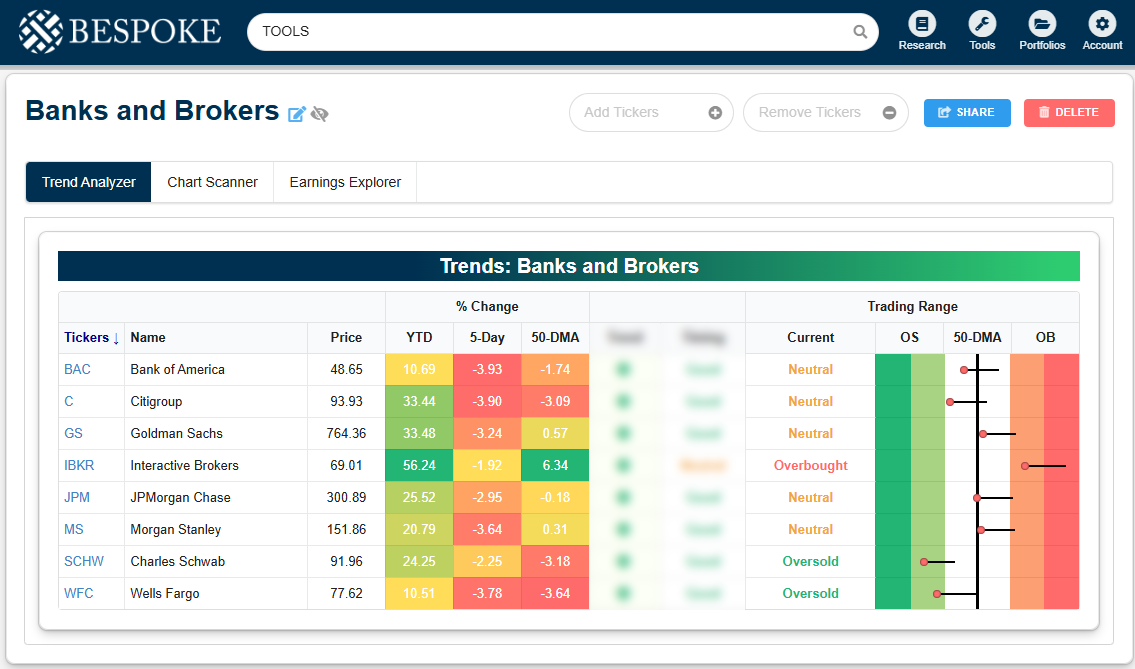
Our Custom Portfolios tool also lets you create baskets like the one below in a few simple clicks to monitor trends and trading ranges for the stocks and ETFs you care about most.
For our “Banks and Brokers” basket, you can see that all of these stocks have pulled back sharply within their ranges over the last week, following Friday’s big pullback. Heading into this week, IBKR was the only name still in “overbought” territory, while SCHW and WFC had both moved into “oversold” territory.
Regardless of recent moves, all eight of these stocks are up at least 10% year-to-date, with IBKR up the most at 56.2%, followed by Goldman and Citi with YTD gains of more than 33%.
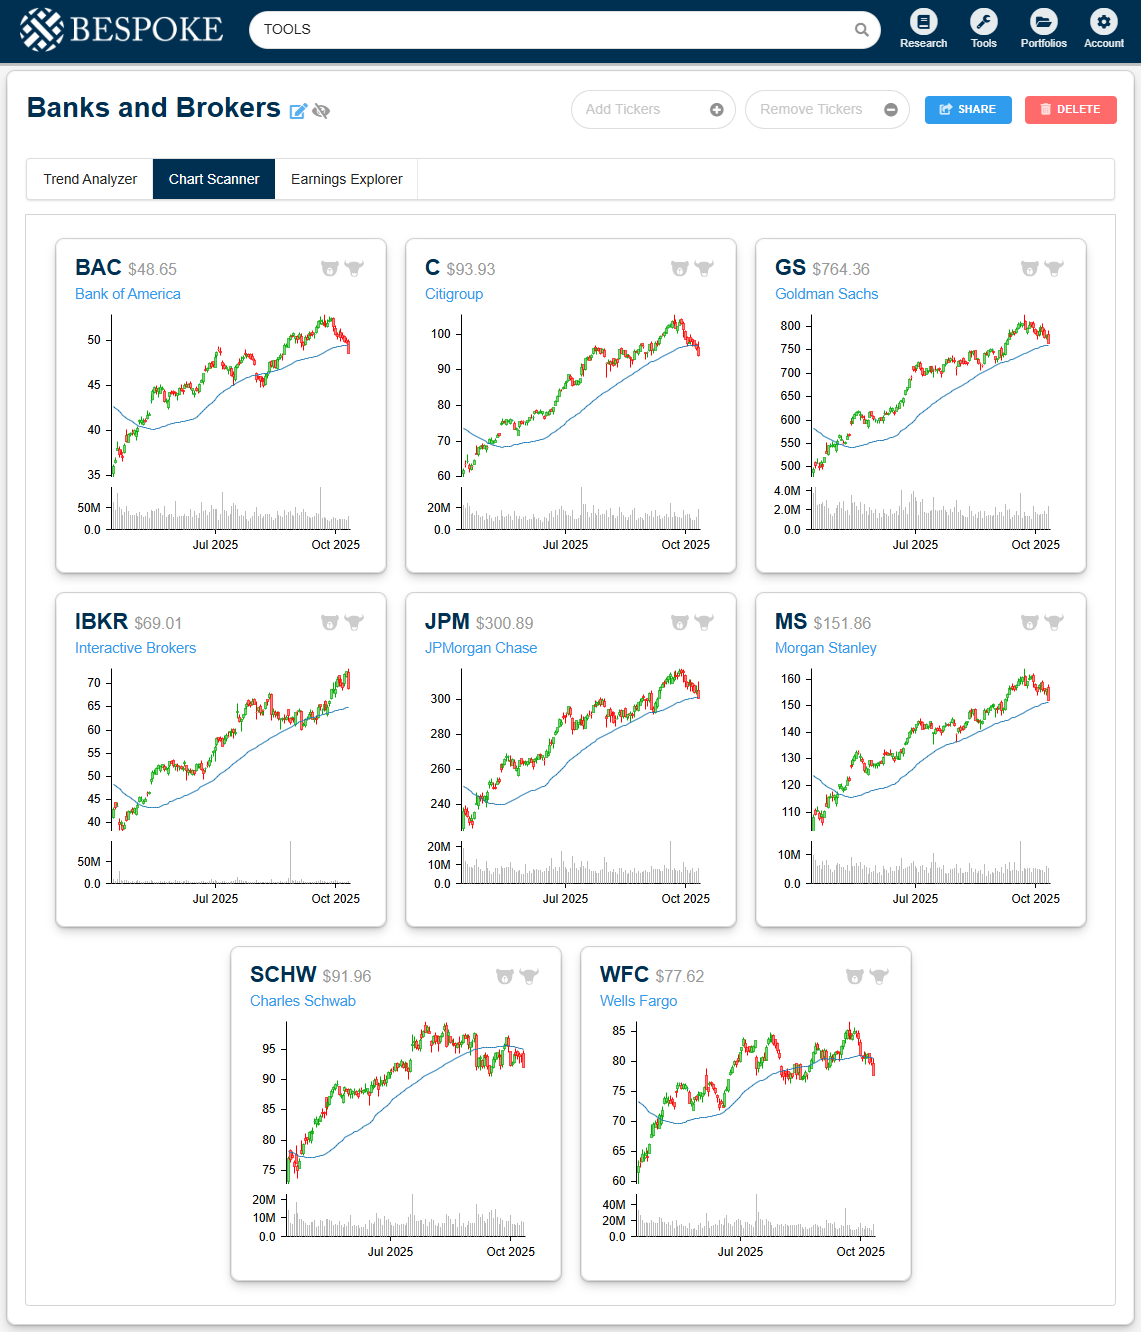
Along with the ability to easily monitor upcoming earnings reports as well as trend and timing measures, our Custom Portfolios tool lets you quickly scan price charts as well.
Below is a snapshot of six-month price charts for our Banks and Brokers basket. Notably, Goldman (GS), Morgan Stanley (MS), and Interactive Brokers (IBKR) were the only three that managed to hang on above their 50-DMAs following last Friday’s big market drop. The rest broke hard below their 50-DMAs, which puts their long-term uptrends at risk.
If you like this analysis and want to try it out with your own stocks and ETFs, simply start a Bespoke Institutional trial now and proceed to the Custom Portfolios tab. It’s super easy! Use this link to get a complimentary two-week trial plus 20% off the regular monthly rate if you choose to stick with it.