Jan 6, 2017
Each month, Bespoke runs a survey of 1,500 US consumers balanced to the demographic weights tracked by the US Census. In the survey, we cover everything you can think of regarding the economy, personal finances, and consumer spending habits. We’ve now been running the monthly survey for more than two years, so we have historical trend data that is extremely valuable, and it only gets more valuable as time passes. All of this data gets packaged into our monthly Bespoke Consumer Pulse Report, which is included as part of our Pulse subscription package that is available for either $39/month or $365/year. We highly recommend trying out the service, as it includes access to model portfolios and additional consumer reports as well. If you’re not yet a Pulse member, click here to start a 30-day free trial now!
Below are charts from our most recent survey (covering the month of December) regarding personal finances. We asked consumers to tell us how they feel about their personal financial situation today, versus last year and also versus the average person. As you can see, since the election, the US consumer is significantly more comfortable with their personal financial position now as well as compared to how they felt last year. You should keep this information handy for next time you hear a CEO or CFO of a struggling retailer tell how “challenging the retail environment” is. It may be challenging, but it’s definitely not because of the consumer!

Dec 31, 2016
Yesterday we posted a bearish chart from our 2017 Bespoke Report market outlook. Lest we end the year on an overly negative note, we thought we’d also post a more positive spin on things. We like to think our outlook paints a full picture, taking into account both the positives and negatives facing investors. In 178 pages of charts, analysis and commentary there is obviously no shortage of important data points, some of which paint a positive, while others a negative picture. Below we’re including one of the more bullish tables from the outlook report. In the table below we show market returns following long periods in a bull market where the S&P fails to make a new bull market high. As can be seen, long consolidation phases without a new high, tend to be followed by positive returns over the following 3, 6 and 12 months. Since we exited a 416 day consolidation phase in July 2016, this certainly qualifies as a positive indicator heading into 2017.
To view the full 2017 Bespoke Report, simply sign up for a 30-day free trial to Bespoke Premium. It’s that easy!

Dec 30, 2016
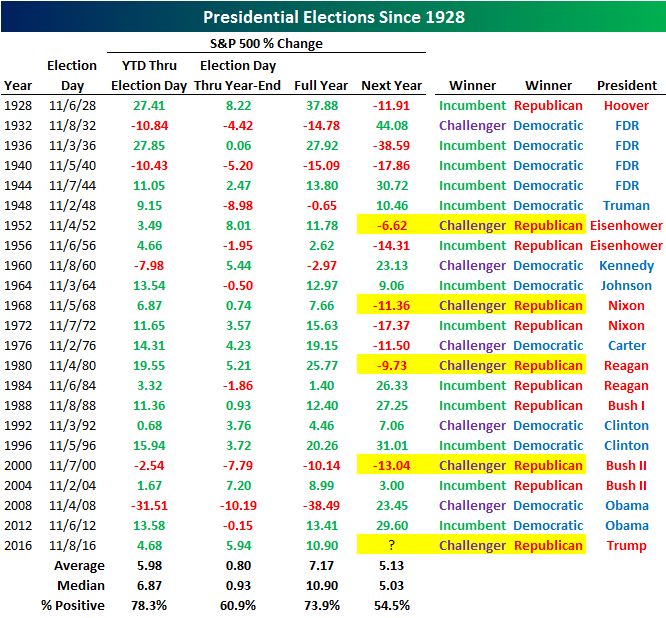
Our 2017 Bespoke Report market outlook contains a comprehensive view of where things stand today and what we expect for markets in 2017. We like to think it paints a full picture, taking into account all the positives and negatives facing investors. In 178 pages of charts, analysis and commentary there is obviously no shortage of important data points, some of which are bullish and some bearish. Below we’re including one of the more bearish tables from the outlook report. In an admittedly small sample set of only four historical examples, each time in history that a Republican president has followed a Democrat, stocks have fallen in the first year of the Republican administration. Returns were anywhere from -6.6% (Eisenhower) to -13.0% (Bush II). Lest we end 2016 on an overly pessimistic note, perhaps we’ll post a more bullish chart from the outlook report before the ball drops.
To view the full 2017 Bespoke Report, simply sign up for a 30-day free trial to Bespoke Premium. It’s that easy!
Oct 5, 2016
On Friday, September 30th, we held our Q4 Outlook call for clients. This is the third quarter in a row we’ve held an outlook call, which has proven to be a very popular feature among Bespoke clients. The quarterly outlooks are an outgrowth of Bespoke’s widely read and quoted annual outlook piece, The Bespoke Report, which is released at the end of December each year. A recording of Friday’s call and the 26-page presentation are available with any paid membership to Bespoke. Review our subscription options and choose any plan to listen to the call and view the presentation.
One of the most popular elements of the outlook (this quarter and in the past) is our view of analyst sentiment heading into earnings season. We never mean to kick the analyst community, but historically speaking, sentiment among analysts has been a great contrarian indicator for stock performance. As has been the case for quite some time, analysts are once again lowering forecasts heading into this earnings season, which officially kicks off on 10/10 with Alcoa (though the bulk of earnings reports won’t come out til later in the month). As you can see in the preview of the slide below, there are a few notable points about this upcoming earnings season:
- Technology and Utilities are the only two sectors with a positive “earnings revision spread,” which means the bar may be set too high for those sectors (remember, earnings revision spread is a contrarian indicator in our view).
- While analysts are negative, management teams are actually much more positive: “warnings” from companies about results are at relatively low levels for this time of year.
- In the last 23 quarters in which the revisions spread was negative, the S&P 500 traded higher 18 times.
As mentioned earlier, the outlook presentations (including recording of the calls) are available with ALL of our membership levels. Review our subscription options and choose any plan to access our Q4 Outlook along with the rest of Bespoke’s daily research.

Oct 3, 2016
On Friday, September 30th, we held our Q4 Outlook call for clients. This is the third quarter in a row we’ve held an outlook call, which has proven to be a very popular feature among Bespoke clients. The quarterly outlooks are an outgrowth of Bespoke’s widely read and quoted annual outlook piece, The Bespoke Report, which is released at the end of December each year. A recording of Friday’s call and the 26-page presentation are available with any paid membership to Bespoke. Review our subscription options and choose any plan to listen to the call and view the presentation. In the call, we discussed:
- Why we think valuations are excessive but are not likely to be the spark for a sell-off.
- Why from a seasonality perspective, we were not surprised at all by the uptick in volatility in September.
- Why weak sentiment among individual investors and the analyst community are key contrarian support indicators heading into Q4.
- Why technicals, seasonality and history support a positive outlook for stocks in Q4.
- Why elections matter for Q4 performance.
In addition to looking forward to Q4, we also looked back to see what worked in Q3. As you can see in the preview below of one page from the presentation, Q3 was all about “rotation.” The biggest winners from the first half of 2016 were the big losers in Q3, while the weakest stocks in the first half out-performed dramatically in Q3. That probably doesn’t bode well for active managers like hedge funds, unless they managed to rotate their books appropriately!
