The Closer – Hyperscaler Pressure, New Low for Breadth, Positioning – 6/22/26
Log-in here if you’re a member with access to the Closer.
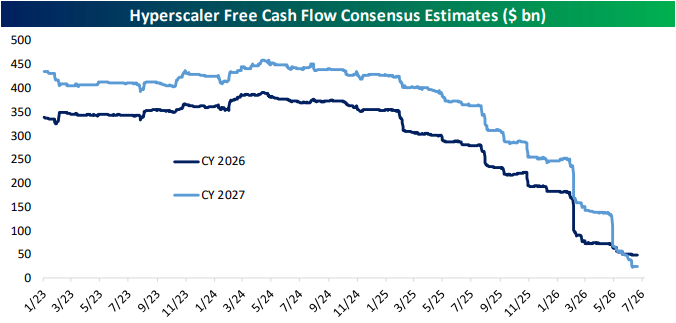
- While AI picks and shovel stocks continue to perform well, hyperscalers have come under some pressure.
- Massive capex spending from hyperscalers has led analysts to expect nearly all operating cash flows to be eaten up.
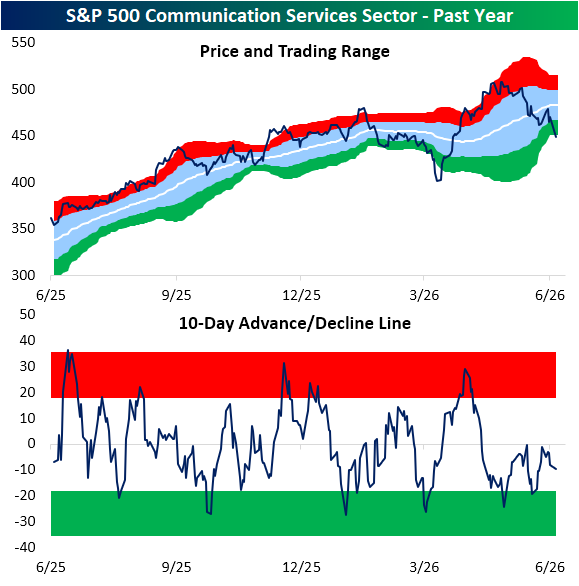
- The Communication Services sector’s cumulative A/D line hit a 52-week low.
See today’s full post-market Closer and everything else Bespoke publishes by starting a 14-day trial to Bespoke Institutional today!
Daily Sector Snapshot — 6/22/26
Chart of the Day: Poor Communication
Communication Services Needs a Breadth Mint
Before closing the doors for the long weekend, on Thursday we published an extended version of our Sector Snapshot with commentary on each of the eleven S&P 500 sectors. Home to mega-caps like Alphabet (GOOGL) and Meta Platforms (META), the Communication Services sector has been an underperformer of late.
The sector is by far the worst performer today as it currently trades down 2% as of this writing, with shares of Alphabet (GOOGL) a major drag; the stock is down mid-single digits for its worst day of the past year following headlines that some of the company’s high-profile AI talent will be leaving the company.
Due to the weakness, Communication Services is now “extremely oversold” (2+ standard deviations below its 50-DMA). While it has been a drag, not all of the weakness has been due to mega-caps. As shown by the sector’s 10-day advance/decline line below, breadth has been weak, and that’s been the case for some time now.
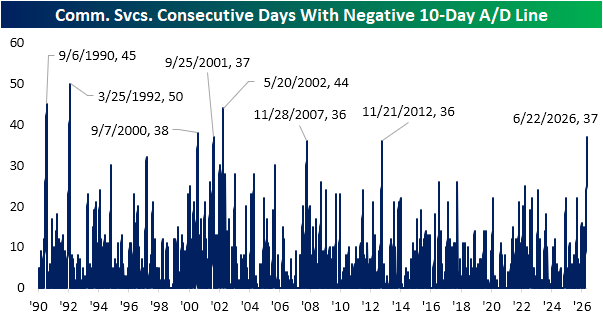
In fact, and as we first highlighted in last week’s Sector Snapshot, the sector has now seen a negative reading in its 10-day A/D line for 37 straight sessions through today. That is now the longest streak of negative readings in over 24 years, surpassing two that lasted 36 days in 2007 and 2012.
Want more from Bespoke? You can start by joining our Think BIG mailing list, where you’ll receive an interesting market stat in your inbox a few times per week. All we need is your email address. Join now by clicking here or on the image below.

Bespoke’s Consumer Pulse Report – June 2026
Bespoke’s Consumer Pulse Report is an analysis of a huge consumer survey that we run each month. Our goal with this survey is to track trends across the economic and financial landscape in the US. Using the results from our proprietary monthly survey, we dissect and analyze all of the data and publish the Consumer Pulse Report, which we sell access to on a subscription basis. Sign up for a 30-day free trial to our Bespoke Consumer Pulse subscription service. With a trial, you’ll get coverage of consumer electronics, social media, streaming media, retail, autos, and much more. The report also has numerous proprietary US economic data points that are extremely timely and useful for investors.
We’ve just released our most recent monthly report to Pulse subscribers, and it’s definitely worth the read if you’re curious about the health of the consumer in the current market environment. Start a 30-day free trial for a full breakdown of all of our proprietary Pulse economic indicators.

Bespoke’s Morning Lineup – 6/22/26 – Exit Maestro
See what’s driving market performance around the world in today’s Morning Lineup. Bespoke’s Morning Lineup is the best way to start your trading day. Read it now by starting a two-week trial to Bespoke Premium. CLICK HERE to learn more and start your trial.
“I know you think you understand what you thought I said but I’m not sure you realize that what you heard is not what I meant.” – Alan Greenspan

Below is a snippet of commentary from today’s Morning Lineup. Start a two-week trial to Bespoke Premium to view the full report.
After a long weekend, markets appear to be stuck in snooze. The S&P 500 is indicated to open 0.03% lower, while the Nasdaq prices in a gain of less than 0.2%. Treasury yields are modestly higher, but the 10-year yield remains below 4.5%. Oil Prices are modestly lower after Iran noted “major progress” in talks with the US. Gold is fractionally lower while Bitcoin bounces and makes a run towards $65K.
There’s some sad news to report this morning as former Fed Chair Alan Greenspan passed away at the age of 100. Greenspan earned the nickname “The Maestro” not just because he was credited with steering the economy through the longest peacetime expansion in history, but also because he was an accomplished musician who attended the Juilliard School, where he played the clarinet and sax.
Asian markets started the week on a positive note. The Nikkei 225 rallied 1.6% while South Korea gained 0.7%, with both hitting record highs. Hong Kong’s Hang Seng bucked the bullish trend, falling 0.7%. The big news in South Korea’s rally was SK Hynix overtaking Samsung as the country’s largest company by market cap after the stock has tripled – yes, tripled – since February.
In Europe, it’s been a listless session to start the week. The STOXX 600 is basically unchanged, while UK stocks are up fractionally following news that PM Starmer will resign. To the downside, Germany, France, and Italy are all down around 0.5% or less.
In the US today, there’s no economic or earnings data on the calendar.
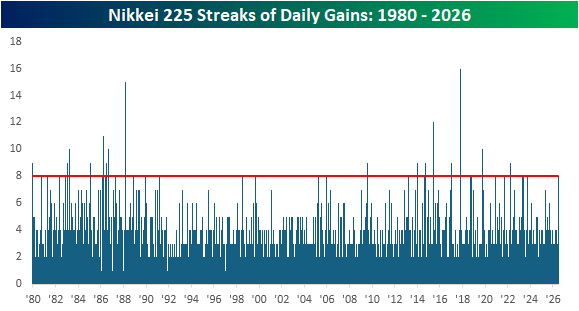
With Japanese stocks rallying overnight, the Nikkei 225 did something it hasn’t done in 37 years by closing at a record high for six straight sessions. The chart below shows streaks of all-time closing highs in the Nikkei 225, and it is one of the stranger charts you’ll see, given that the index went decades without hitting a record high after the bubble burst in 1989. Before 1989, there were multiple streaks of six or more record highs, but the current one is the longest since 1989.
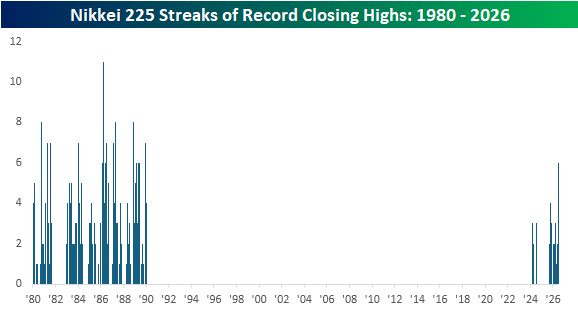
In addition to closing at six straight record highs, the Nikkei has also closed higher for eight straight sessions, and those types of streaks have been frequent throughout history, even during the drought of all-time highs. This current streak of higher closes is the first eight-day streak since September 2023 and tied for the longest since March 2022.
Start a two-week trial to Bespoke Premium to continue reading today’s full Morning Lineup.
Brunch Reads – 6/21/26
Welcome to Bespoke Brunch Reads — a linkfest of some of our favorite articles over the past week. The links are mostly market-related, but there are some other interesting subjects covered as well. We hope you enjoy the food for thought as a supplement to the research we provide you during the week.
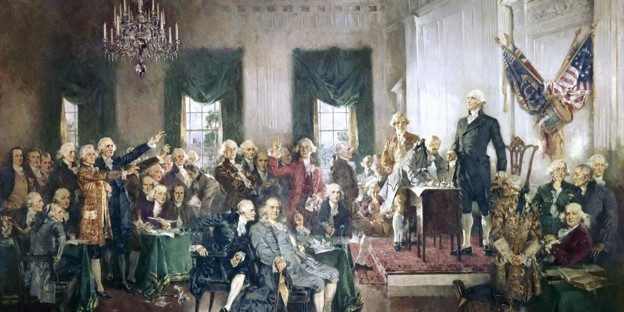
We the People: The 250th birthday of the United States is right around the corner, and today marks the anniversary of a historic achievement that has helped the country make it this far. On June 21, 1788, the United States Constitution officially became law when New Hampshire became the ninth state to ratify it. Under the Constitution’s own terms, approval by nine of the thirteen states was enough to replace the weak Articles of Confederation and establish a stronger national government. After years of political uncertainty following the Revolutionary War, the new framework promised greater stability by creating separate executive, legislative, and judicial branches and defining the balance of power between the states and the federal government.
The Constitution did not take effect everywhere immediately. Several key states, including Virginia and New York, ratified it only after New Hampshire’s vote. Even so, June 21 marked the decisive turning point when the Constitution moved from a proposal on paper to the governing law of the new nation. The first federal government under the Constitution began operating the following year, with the inauguration of George Washington in April 1789.
More than two centuries later, the Constitution remains the foundation of the American political system. Though amended and interpreted over time, the document ratified in 1788 continues to shape the rights of citizens, the structure of government, and the rule of law in the United States.
Food
German Soccer Fan Goes Viral as He Discovers Waffle House and Other U.S. Food Spots in World Cup Road Trip (People)
A German soccer fan has attracted hundreds of thousands of followers by documenting his World Cup road trip across the US, treating stops at Taco Bell, Walmart, Waffle House, Chili’s, and Buc-ee’s with the same enthusiasm many tourists reserve for famous landmarks. His posts about oversized stadiums, endless drink choices, Southern scenery, and unexpected acts of kindness have become a celebration of everyday American experiences through the eyes of a first-time visitor. [Link]
Continue reading our weekly Brunch Reads linkfest by logging in if you’re already a member or signing up for a trial to one of our two membership levels shown below! You can cancel at any time.

The Closer – TIAA, Student Loans, 5 Fed – 6/18/26
Log-in here if you’re a member with access to the Closer.
- The S&P 500 gained over 1%, although its highs and lows were inside of yesterday’s intraday range.
- Since the hawkish toned FOMC decision, it has been the highest dividend yield stocks that have fallen the most.
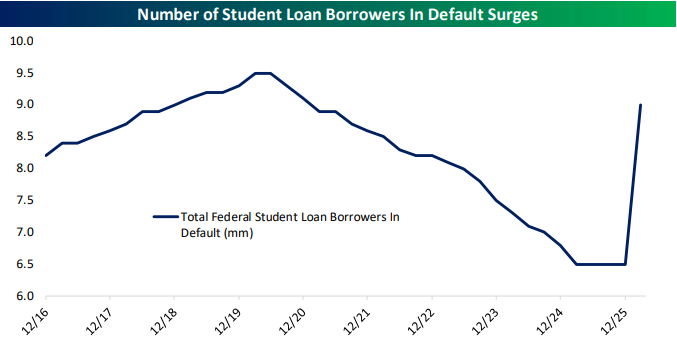
- Policy changes have resulted in a surge in the number of delinquent student loans with 38% of total borrowed student loan balances in forbearance or deferment and 12% in default.
See today’s full post-market Closer and everything else Bespoke publishes by starting a 14-day trial to Bespoke Institutional today!
Bespoke’s Weekly Sector Snapshot — 6/18/26
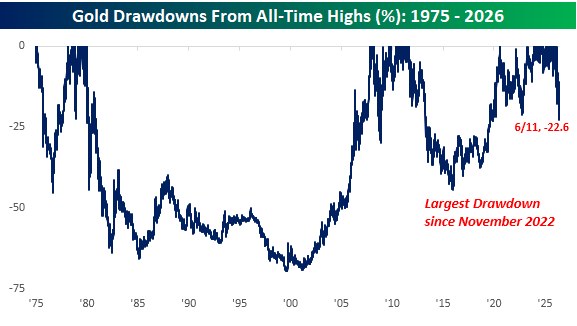
Gold Drawdowns
After a historic run in 2025 that continued into January, gold prices have rediscovered gravity over the last five months. After hitting an intraday high of $5,586.20 per ounce on 1/29, prices have declined by more than 20%, forming a steady downtrend in the process. Earlier this month, prices broke below the 200-day moving average (DMA) for the first time since November 2023, ending a streak of more than 600 trading days above that level. From an intraday low of $4,046 on 6/11, gold attempted a rally but stalled out just below the 200-DMA.
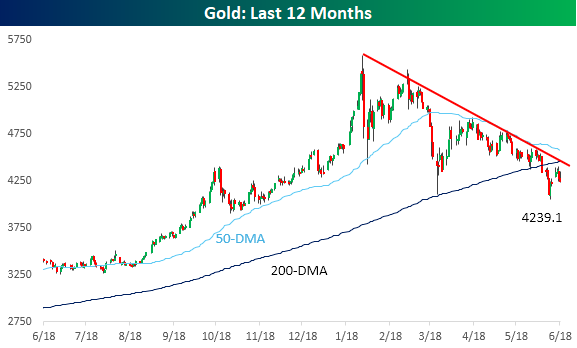
Gold prices are set to close out the week more than 20% below their January closing high, and as of 6/11 were down 22.6% from that level. As shown in the chart, this ranks as the largest drawdown for the metal since November 2022. Despite that relatively deep hole, it’s interesting to note that historically, gold has traded in a 36% drawdown relative to all-time highs due to essentially 20 years over the last 50 years when it was consistently in a drawdown of at least 50%. It hasn’t been a great five months for gold, but it could easily be worse.
Want more from Bespoke? You can start by joining our Think BIG mailing list, where you’ll receive an interesting market stat in your inbox a few times per week. All we need is your email address. Join now by clicking here or on the image below.