Another Fed Day Ends in the Red
Another Fed day is in the books, and the Fed Funds target rate is now 50 bps higher than it was yesterday. In tonight’s Closer, we will provide further commentary on the content of the FOMC’s statement, SEP, Fed Chair Powell’s presser, and the market reaction. With the S&P 500 finishing the day down 0.61%, today marked the third decline on a Fed day in a row. That is the longest streak of consecutive declines on Fed days since the three meetings ending July of last year. Looking at the price action of the S&P over the past three meetings, today basically stuck to the script. Whereas the index traded higher throughout most of the session leading up to the release of the policy decision, it plummeted when the statement hit the tape. That drop brought the index into the red on the day in a similar way to the September meeting. Declines kept on coming until shortly after Powell took the podium. From there, the S&P 500 rebounded, even pivoting back into the green briefly around the time of the conclusion of the presser. While it did not go on to end the day at the lows of the day like the past couple of meetings, Powell’s presser that pumped stocks back into the green was not long-lasting as the S&P dipped back into the red in the final hour of trading. Click here to learn more about Bespoke’s premium stock market research service.

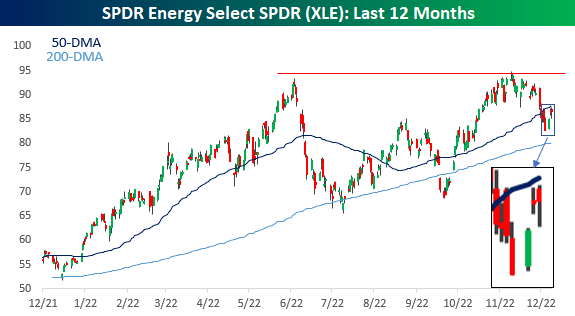
Energy Losing Its Grip
You know those scenes in the movies where a character finds themselves hanging off a bridge, and slowly their sweaty grip starts to loosen as a finger or two starts to slip? That’s what the energy sector is going through right now. As oil prices have been under pressure over the last few months, energy stocks had been holding up relatively well as the S&P 500 Energy sector hit a new cycle high exactly a month ago today. Since then, the sector has declined nearly 9% even as the S&P 500 has moved higher. Last week, the sector broke below its 50-DMA for the first time in over two months before stabilizing this week. Since that break below the 50-DMA on 12/6, the sector has made multiple intraday attempts (including today) to get back above it, but each time the sector has sold off and finished off its intraday highs. When looking at a price chart, any time you see a security break below a key moving average and then make several unsuccessful attempts to get back above that level, it’s often a sign of a momentum shift.
On a relative strength basis, the Energy sector is also toeing a key trendline. The chart below compares the relative strength of XLE to the S&P 500 (SPY) over the last year. During that time, Energy’s relative strength has been riding a trendline higher with bounces each time it kissed that level. The most recent example occurred this week, but at this point, the bounce has been meager. Energy stocks have been outperforming energy commodities in recent months, so it’s only natural to see some mean reversion in the stocks as well, but with the sector already breaking below its 50-DMA, this is a key trendline to watch. If the sector’s relative strength weakens further, the technical picture for the sector would weaken materially, which would be a development investors in just about every other sector wouldn’t shed a tear for. Click here to learn more about Bespoke’s premium stock market research service.

Fixed Income Weekly: 12/14/22
Searching for ways to better understand the fixed income space or looking for actionable ideas in this asset class? Bespoke’s Fixed Income Weekly provides an update on rates and credit every Wednesday. We start off with a fresh piece of analysis driven by what’s in the headlines or driving the market in a given week. We then provide charts of how US Treasury futures and rates are trading, before moving on to a summary of recent fixed income ETF performance, short-term interest rates including money market funds, and a trade idea. We summarize changes and recent developments for a variety of yield curves (UST, bund, Eurodollar, US breakeven inflation and Bespoke’s Global Yield Curve) before finishing with a review of recent UST yield curve changes, spread changes for major credit products and international bonds, and 1 year return profiles for a cross section of the fixed income world.
In this week’s report, we discuss the Fed and the outlook for 2023 given a changing FOMC composition.

Our Fixed Income Weekly helps investors stay on top of fixed-income markets and gain new perspectives on the developments in interest rates. You can sign up for a Bespoke research trial below to see this week’s report and everything else Bespoke publishes free for the next two weeks!
Click here and start a 14-day free trial to Bespoke Institutional to see our newest Fixed Income Weekly now!
Bespoke’s Morning Lineup – 12/14/22 – Eight is More Than Enough
See what’s driving market performance around the world in today’s Morning Lineup. Bespoke’s Morning Lineup is the best way to start your trading day. Read it now by starting a two-week trial to Bespoke Premium. CLICK HERE to learn more and start your trial.
“Adventure is just bad planning.” – Roald Amundsen

Below is a snippet of content from today’s Morning Lineup for Bespoke Premium members. Start a two-week trial to Bespoke Premium now to access the full report.
Welcome to the 8th and final FOMC policy announcement of the year. Maybe it’s just us, but we would have been fine with just one or two announcements this year and a whole lot fewer speeches. Markets are pricing in a near certainty of a 50 bps rate hike today bringing the Fed’s total interest rate increases for 2022 to 4.25 percentage points. While markets are pretty certain of what the Fed will do, the big question on everyone’s mind is what is Powell going to say.
Isn’t it ironic that in the age of maximum Fed transparency where Fed officials practically speak multiple times a day that investors really have no idea what kind of tone the Fed chair will take at his news conference today? Will he start off the disclaimer that the Fed is “strongly committed to bringing inflation back down to our 2 percent goal”? Hopefully, Powell got up on the right side of the bed this morning and traffic getting to K street wasn’t too bad.
Futures have been mixed all morning on what has been a quiet day for data. The only release on the calendar was Import and Export Prices. Import Prices fell more than expected (-0.6% vs -0.5%), and Export Prices fell less than expected (-0.3% vs -0.5%). At the end of the day, though, none of this matters. Whatever Powell says will dictate the tone of the day. Any hints of a pause or a lowering in the magnitude of rate hikes going forward will be what bulls need to keep the rally going.
Despite recent comments from FOMC officials looking to downplay the significance of inverted yield curves and their impact on the economy, market participants have been intently focused on both the quantity and persistency of inversion at various points on the US Treasury curve. One of the Fed’s preferred measures of the yield curve is the spread between the yields on the 10-year and 3-month US Treasuries. This morning, the 10y3m curve remains inverted by over 80 basis points (bps) which will mark the 15th straight trading day that the curve was inverted by 50 bps or more.
Going back to 1962, there have been four other periods where the 3m10y curve inverted by 50 bps or more for at least 15 straight trading days. Each of those prior streaks lasted much longer than the current streak, although, with the curve inverted by over 80 bps, this streak can also be expected to last much longer. In terms of where these streaks occurred in the business cycle, in each of the four periods, a recession followed within eight months.

Our Morning Lineup keeps readers on top of earnings data, economic news, global headlines, and market internals. We’re biased (of course!), but we think it’s the best and most helpful pre-market report in existence!
Start a two-week trial to Bespoke Premium to read today’s full Morning Lineup.