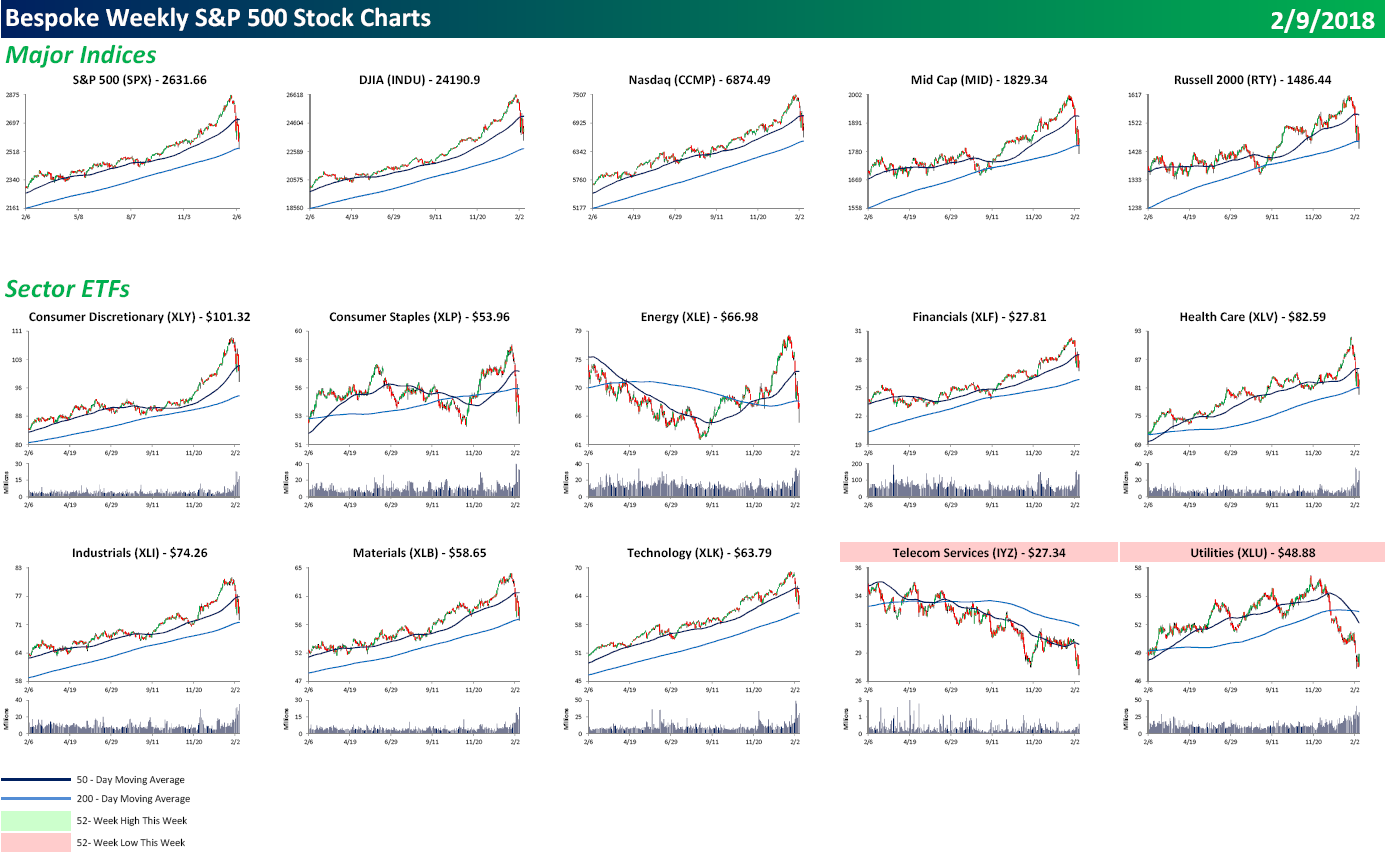
Each weekend as part of our Bespoke Premium and Institutional research service, clients receive our S&P 500 Quick-View Chart Book, which includes one-year price charts of every stock in the S&P 500. You can literally scan through this report in a matter of minutes or hours, but either way, you will come out ahead knowing which stocks, or groups of stocks, are leading and lagging the market. The report is a great resource for both traders and investors alike. Below we show the front page of this week’s report which contains price charts of the major averages and ten major sectors.
Looking through the Chart Book this week, there are a number of broken looking charts, as all the major averages and sectors are below their 50-DMA. Utilities have been especially weak as the sector hit a 52-week low. In terms of individual stocks, 62 members of the S&P 500 hit 52-week lows this week, and they were spread out across just about every sector. In fact, the only two sectors where not a single stock hit a 52-week low were Technology and Telecom Services (which has just three stocks in it). Real Estate was one of the weakest sectors with 19 different components of that sector hitting new lows. It just hasn’t been a good year for interest rate sensitive stocks.
To view our entire S&P 500 Chart Book, sign up for a 14-day free trial to our Bespoke Premium research service.