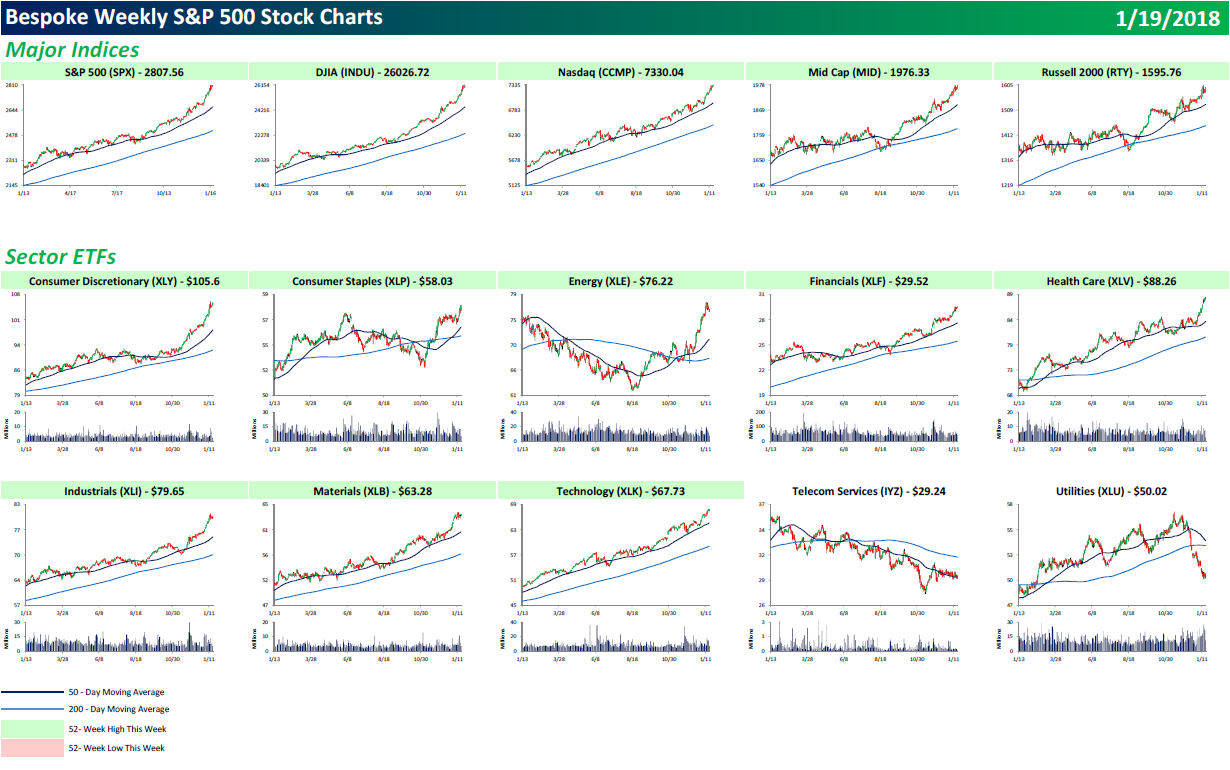
Each weekend as part of our Bespoke Premium and Institutional research service, clients receive our S&P 500 Quick-View Chart Book, which includes one-year price charts of every stock in the S&P 500. You can literally scan through this report in a matter of minutes or hours, but either way, you will come out ahead knowing which stocks, or groups of stocks, are leading and lagging the market. The report is a great resource for both traders and investors alike. Below we show the front page of this week’s report which contains price charts of the major averages and ten major sectors.
In our Chart Book, a green headline means the chart hit a new 52-week high this week. As you can see below, this week all five major US indices hit a new high, while every sector but Utilities and Telecom (two defensives) hit a new high. That’s a lot of green. Folks, take a snapshot of this one, because it doesn’t get much better than this.
You can view our entire S&P 500 Chart Book by signing up for a 14-day free trial to our Bespoke Premium research service.