Jun 27, 2022
The US stock market has been weak and in a downtrend since late 2021, and there are some individual names that haven’t been able to post a positive month in quite some time. Of all S&P 1500 members, there are actually eight stocks with a market cap of at least $2 billion that are on a monthly losing streak of seven or more months. Six of these eight names are members of the Consumer Discretionary sector (the worst performing sector on a YTD basis), which is down 27.8% in 2022 (as of Friday’s close). The largest company on this list is Nike (NKE), which reports after the close today. The stock would need to gain about 7.5% through the end of the month to break its seven month losing streak. The average stock on this list would need to gain 6.7% through the close on 6/31 to break their respective streaks. Etsy (ETSY) is the closest to breaking its streak, needing to gain just 0.9%, while Under Armour (UAA) is the furthest, needing 13.7%. On a YTD basis, these stocks are down an average of 41.4% (median: -35.0%), meaning they would need to gain ~70% through year’s end to finish 2022 in the green.

Below is a quick look at one-year price charts for these eight stocks. (You can click here to create a custom portfolio of these names if you’re a Bespoke client.) Unsurprisingly, these stocks on 7+ month losing streaks are trading in pretty steep long-term downtrends, and they’ve got a lot of work to do to get back to where they were trading late last year. New uptrends can’t emerge until these long monthly losing streaks finally come to an end. Click here to learn more about Bespoke’s premium stock market research service.

Jun 23, 2022
Even as the ten-year yield and crude oil have pulled back over the last few trading sessions and the S&P 500 has recuperated the losses from late last week, the percentage of respondents to the AAII survey considering themselves bullish fell for the third consecutive week. This week’s reading of 18.2% marks the lowest level since late April and ranks in the bottom 1.3% of all weeks going back to the start of the survey in 1987. On the bright side, the rate of decline in bullish sentiment has been on the decline as the percentage of respondents that considered themselves bullish fell by 11 percentage points two weeks ago, 1.6 percentage points last week, and now just 1.2 percentage points this week.

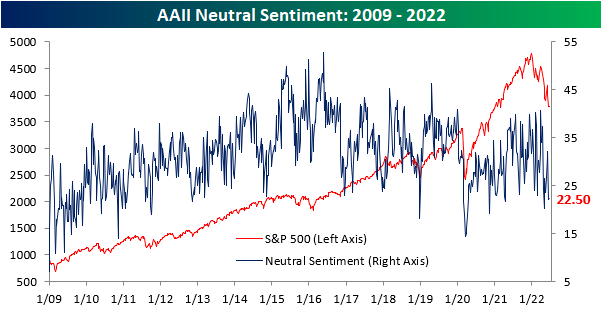
The percentage of respondents reporting neutral sentiment moved modestly higher, increasing by just 30 basis points to 22.5%. Click here to learn more about Bespoke’s premium stock market research service.
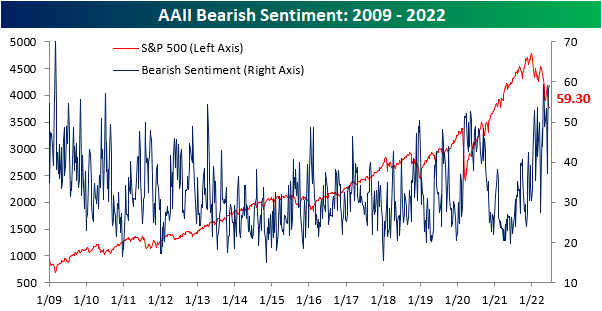
The percentage of respondents reporting bearish sentiment rose for the third consecutive week to 59.3%, the highest level since late April. The 4/28 reading was only 10 basis points higher than this week’s, so we are near the previous peak in terms of bearish sentiment. Apart from the late April reading, bearish sentiment had not topped 59% since early March of 2009. In fact, this week’s reading is in the 97th percentile of all readings since the survey began in 1987.
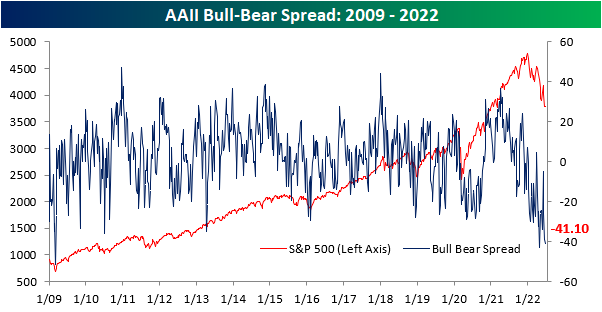
The bull-bear spread remains near historic lows, and there have now been 22 consecutive weeks in which the spread was below -10 (smoothed out by taking a four week moving average). We are now just four weeks away from setting a new record in this regard. The previous high was in 1991 when there were 26 consecutive weeks in which the bull-bear spread was under -10. Investors often view this as a contrarian indicator, as low readings in bullish sentiment leave upside for the market should sentiment bottom out and positive news emerge. Click here to learn more about Bespoke’s premium stock market research service.