Jul 12, 2022
As of today, the percentage of inverted points on the yield curve reached the YTD highs seen in mid-June of 17.9%. This comes as the 10-year and 1-year invert, as well as the 5-year and 2-year. The inversion of points on the yield curve (particularly 2s&10s) tends to be cited as a leading recession indicator, due to the fact that higher near-term yields imply a higher risk in the near-term rather than the long-term, the inverse of what is typically true. The graph below shows the rolling percentage of inverted points on the curve over the last six months. Click here to learn more about Bespoke’s premium stock market research service.

As mentioned above, the spread between the 10-year and 1-year treasury inverted today, which is the first occurrence since October of 2019. Following prior inversions of this part of the yield curve since 1970, a recession has followed in the next two years 99.8% of the time which would suggest that a recession at some point in the next two years is almost certain. Following the first inversion in at least one year when a recession did follow, it has taken an average of 271 trading days to officially enter a recession. The shortest time it took to enter into a recession following 1s and 10s inversion was in 1973, when it took just 191 trading days. As mentioned, going back to 1970, recessions have followed within two years of an inversion 99.8% of the time. The only time that this part of the curve inverted and a recession did not follow within two years was after a brief stint in the fall of 1998.

Jun 13, 2022
In recent years, one of the major arguments made for equity market bulls was the fact that there was no alternative (TINA). TINA was a tough strategy to argue against as fixed income markets were offering incredibly low, if anything in the way of yields, especially relative to inflation expectations. However, the Fed’s hawkish pivot has caused yields to tick significantly higher, reaching the highest level in about a decade in early June. This certainly changes the investment landscape, as alternatives to equities become more attractive and the discount rate used to revert future corporate cash flows to present-day dollars increases.
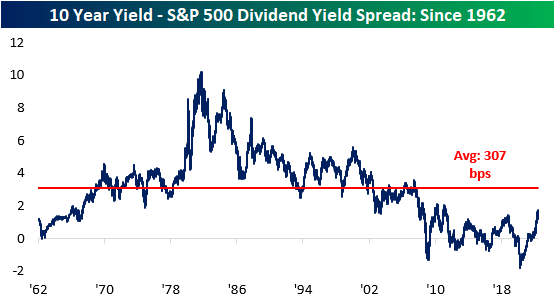
The 10-year Treasury note is now offering investors a yield of 3.4%, which is more than 2 times higher than the level at the start of the year. Notably, the current 10-year yield of 3.4% is 172 basis points higher than the dividend yield of the S&P 500 (which is 1.6%). This widening spread decreases the attractiveness of equities and increases the appeal of fixed income assets, which can lead to further downside in the S&P 500. Although the spread has moved significantly higher as of late, it is still compressed relative to historical averages, meaning that yields could still rise further and the spread between long-term Treasuries and the S&P 500’s dividend yield would be narrower than the long-term average.
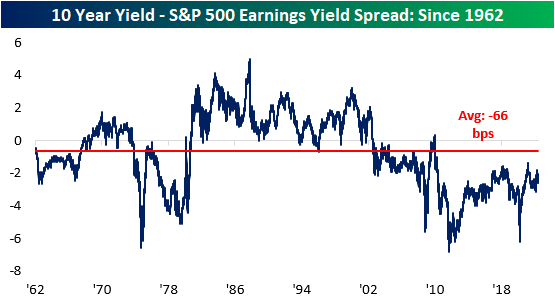
Another metric worth tracking is the earnings yield of the S&P 500 versus the 10-year yield. The earnings yield (the inverse of the P/E ratio) is currently 218 basis points higher than the 10-year yield. If this spread were to turn negative, it would imply that risk-free assets would be generating superior earnings than riskier equities. Nonetheless, the S&P 500 earnings yield is still well above that of the 10-year yield, so equities do still appear attractive on an absolute basis, implying that investors are still being compensated for the excess risk taken by investing in public equities. Throughout history, there have been periods where the earnings yield was less than the 10-year yield for extended periods of time, and while this would seem counter-intuitive, unlike fixed income, where capital appreciation is capped, capital appreciation for equities is theoretically unlimited.
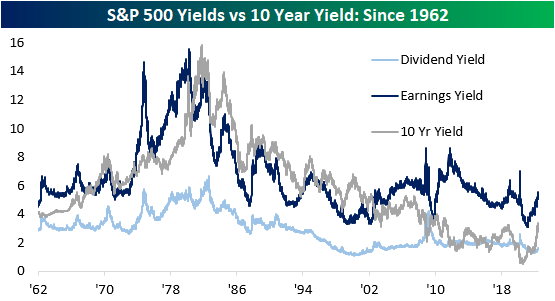
The chart below aggregates the S&P 500 earnings yield, dividend yield, and the 10-year treasury yield. As you can see, the earnings yield has been higher than the treasury yield since 2002. The tightening of this spread decreases the attractiveness of equities relative to 10-year Treasuries, which we have seen occur over the last several months. Click here to become a Bespoke premium member today!
Apr 6, 2022
See what’s driving market performance around the world in today’s Morning Lineup. Bespoke’s Morning Lineup is the best way to start your trading day. Read it now by starting a two-week trial to Bespoke Premium. CLICK HERE to learn more and start your trial.
“Bond investors are the vampires of the investment world. They love decay, recession – anything that leads to low inflation and the protection of the real value of their loans.” – Bill Gross
It’s looking like it’s going to be one of those days. Futures were just modestly negative overnight but then started to really weaken as Europe opened for trading and things haven’t stabilized since. The S&P 500 faces losses of around 1% at the open with the Nasdaq down over 1.5%. If equities were looking to rally coming into the week, yesterday’s Fed commentary put at least a temporary stop to that. Interest rates are higher across the curve and the 2s10s yield curve has steepened well out of inverted territory, but that comes along with yields on the 10-year above 2.6% to its highest level in just over three years.
The economic calendar is light today as weekly mortgage applications were the only release, and they fell 6.3% following a 6.8% last week and an 8.1% decline the week before that. Besides that, Energy inventories will be released at 10:30 and the Minutes from March’s FOMC meeting will be released at 2 PM. Philly Fed President Harker and Richmond Fed President Barkin will also be speaking this morning.
Read today’s Morning Lineup for a recap of all the major market news and events from around the world, including the latest US and international COVID trends.
For bond investors, these days are tough indeed. With inflation rampant around the world and central banks finally putting the brakes on the gravy train of liquidity, the increase in interest rates has been relentless with bond prices seeing some of their largest declines in years. A case in point is the iShares 20+ Year US Treasury Bond ETF (TLT). It’s already down 13% YTD and indicated to open lower today by another 1%. The chart below shows historical drawdowns from record closing highs in TLT since its inception in late 2002. Based on where the ETF is trading this morning, it has now declined 26% from its last record closing high back in early August 2020. Throughout its history, there have only been a handful of other periods where TLT ever experienced a peak to trough decline of more than 20%, and the only other time it dropped more was coming out of the Financial Crisis.

Start a two-week trial to Bespoke Premium to read today’s full Morning Lineup.