Apr 14, 2022
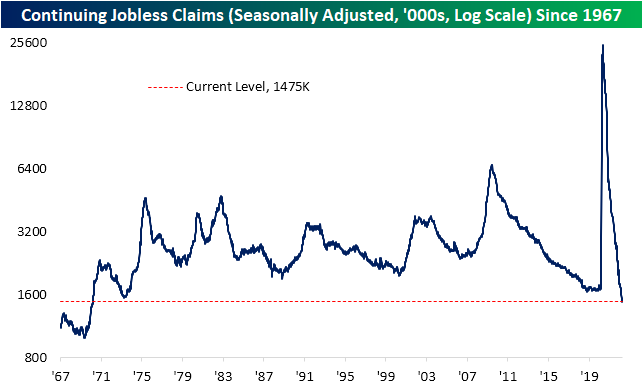
After coming in at one of the lowest levels on record last week, seasonally adjusted initial jobless claims bounced up to 185K this week. While higher, jobless claims are still historically strong having spent a record eight straight weeks with sub-200K readings.

As we noted last week, seasonal adjustments overstated the strength of claims as unadjusted claims experienced a seasonally unusual decline. This week was more normal from a seasonal perspective with initial claims rising from 194.4K to 222.5K and the first reading above 200K since the week of March 11. As shown in the second chart below, the current week of the year has consistently seen claims move higher week over week marking a temporary high before resuming the seasonal downtrend through the next couple of months. That means the slight uptick this month is likely mostly seasonal and far from any sort of a change in trend.

Lagged one week to initial claims, continuing jobless claims fell to a new low of 1.475 million. That is the lowest level of claims since March 1970. Click here to view Bespoke’s premium membership options.
Apr 14, 2022
The “Bespoke 50” is a basket of noteworthy growth stocks in the Russell 3,000. To make the list, a stock must have strong earnings growth prospects along with an attractive price chart based on Bespoke’s analysis. The Bespoke 50 is updated weekly on Thursday unless otherwise noted. There were no changes to the list this week.
The Bespoke 50 is available with a Bespoke Premium subscription or a Bespoke Institutional subscription. You can learn more about our subscription offerings at our Membership Options page, or simply start a two-week trial at our sign-up page.

The Bespoke 50 performance chart shown does not represent actual investment results. The Bespoke 50 is updated weekly on Thursday. Performance is based on equally weighting each of the 50 stocks (2% each) and is calculated using each stock’s opening price as of Friday morning each week. Entry prices and exit prices used for stocks that are added or removed from the Bespoke 50 are based on Friday’s opening price. Any potential commissions, brokerage fees, or dividends are not included in the Bespoke 50 performance calculation, but the performance shown is net of a hypothetical annual advisory fee of 0.85%. Performance tracking for the Bespoke 50 and the Russell 3,000 total return index begins on March 5th, 2012 when the Bespoke 50 was first published. Past performance is not a guarantee of future results. The Bespoke 50 is meant to be an idea generator for investors and not a recommendation to buy or sell any specific securities. It is not personalized advice because it in no way takes into account an investor’s individual needs. As always, investors should conduct their own research when buying or selling individual securities. Click here to read our full disclosure on hypothetical performance tracking. Bespoke representatives or wealth management clients may have positions in securities discussed or mentioned in its published content.
Apr 13, 2022
Searching for ways to better understand the fixed income space or looking for actionable ideas in this asset class? Bespoke’s Fixed Income Weekly provides an update on rates and credit every Wednesday. We start off with a fresh piece of analysis driven by what’s in the headlines or driving the market in a given week. We then provide charts of how US Treasury futures and rates are trading, before moving on to a summary of recent fixed income ETF performance, short-term interest rates including money market funds, and a trade idea. We summarize changes and recent developments for a variety of yield curves (UST, bund, Eurodollar, US breakeven inflation and Bespoke’s Global Yield Curve) before finishing with a review of recent UST yield curve changes, spread changes for major credit products and international bonds, and 1 year return profiles for a cross section of the fixed income world.
In this week’s report we highlight a fixed income investment that has performed beautifully amid extremely high inflation.

Our Fixed Income Weekly helps investors stay on top of fixed income markets and gain new perspective on the developments in interest rates. You can sign up for a Bespoke research trial below to see this week’s report and everything else Bespoke publishes free for the next two weeks!
Click here and start a 14-day free trial to Bespoke Institutional to see our newest Fixed Income Weekly now!
Apr 13, 2022
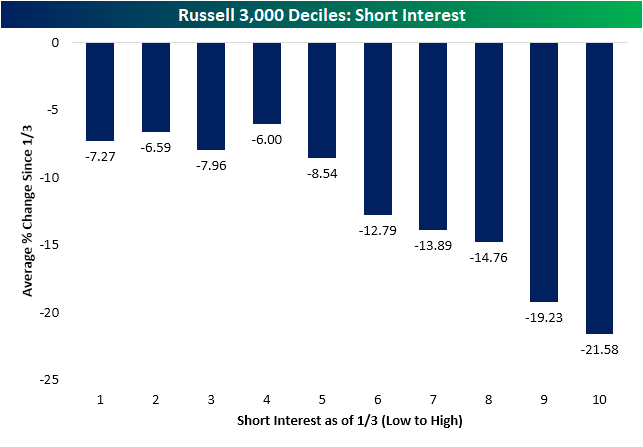
The first quarter of last year was marked by a period of massive short squeezes leading to outperformance of stocks with high levels of short interest. A little over one year later, the opposite has held true. As shown below, the stocks with the highest levels of short interest at the time of the last all time high on January 3rd have been the worst performers over the past few months. The decile of Russell 3,000 stocks with the highest levels of short interest at the start of the year have fallen 21.5% since January 3td while the first four deciles of stocks with the lowest levels of short interest have only fallen mid-single digits.
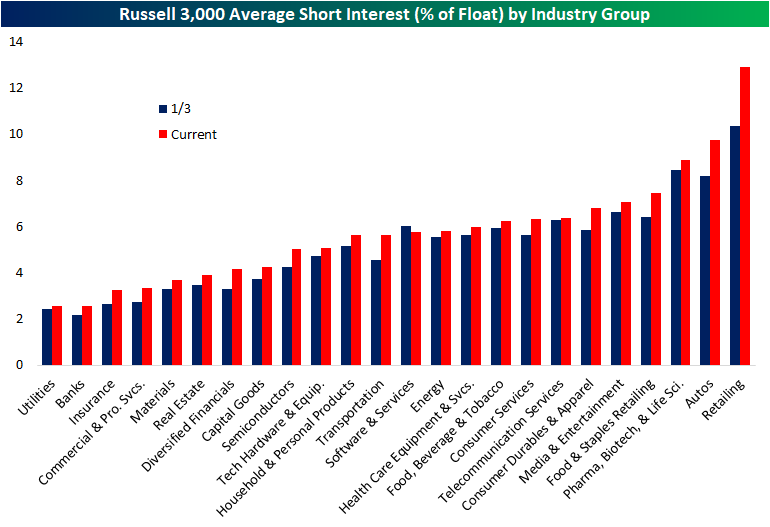
The latest update of short interest data through the end of March hit the tape earlier this week. The average level of short interest as a percent of float for all Russell 3,000 stocks fell sequentially from the mid-March update but with an average short interest reading of 5.78%, current readings are roughly half of one percentage point higher than at the start of the year.
Breaking it down by industry group, retail has seen the biggest increase in average short interest and now has the highest level of any industry group. Autos are the runner-up in both departments as short interest has climbed from 8.2% on January 3rd to 9.75% today. Utilities, Banks, Insurance, Commercial and Professional Services, Materials, and Real Estate, meanwhile, are on the other end of the spectrum as the only sectors with short interest as a percentage of float below 4%.
Turning to individual stocks, Rent the Runway (RENT) now has the most elevated level of short interest as the only stock in the index with over half of its free-floating shares sold short. Conn’s (CONN), however, comes close with 49.16% of its float sold short. Both stocks have seen sharp increases in bearish bets this year as those readings compare to 26.82% and 14.58%, respectively for RENT and CONN. Most of these heavily shorted names have been pain trades this year, but there are a small handful of exceptions. Gogo (GOGO) and Arch Resources (ARCH) have seen substantial rallies of 66.3% and 72.45%, respectively, as the broader market has pulled back. While not as strong of a performance, Dillard’s (DDS) has also rallied solidly gaining 16%.

As previously mentioned, CONN finds itself near the top of the list of the most heavily shorted Russell 3,000 stocks, but it has been the one with the largest increase in short interest of the whole index since the January 3rd high. No other name has seen short interest rise by more than 30 percentage points in that time, but MedAvail (MDVL), Rent the Runway (RENT), and Frontier (ULCC) have seen readings rise over 20 percentage points. Click here to view Bespoke’s premium membership options.

Apr 13, 2022
Bespoke’s Little Known Stocks (LIKS) report highlights a company that may not be on the traditional radar of most investors. In this report, we provide an in-depth analysis of the little known stock, including industry insights, growth lever analysis, insights to the competitive landscape, equity performance, relative valuation, operational efficiency, pros & cons, and more. This week’s report is about an innovative medical devices company that is disrupting the cosmetic procedure market.

As always, this report is for informational purposes only and is not a recommendation to buy or sell any specific securities. Investors should do their own research and/or work with a professional when making investment decisions. Highlighting a stock doesn’t mean we are bullish or bearish on it. Our goal is simply to provide readers with facts to help them make informed decisions rather than just opinions.
Bespoke’s LIKS reports are available at the Bespoke Institutional level only. You can sign up for Bespoke Institutional now and receive a 14-day trial to read our LIKS reports. To sign up, choose either the monthly or annual checkout link below:
Bespoke Institutional – Monthly Payment Plan
Bespoke Institutional – Annual Payment Plan