Jun 1, 2022
Coming out of Memorial Day weekend, WTI crude oil closed out May with its sixth straight monthly gain, resulting in the second-longest streak going back to 1983. Everyone with a car has dealt with rising costs at the pump, and the AAA national average price per gallon is currently $4.67, the highest level on record. This comes as the Biden administration has halted the importation of Russian oil, and the European Union attempts to reduce its energy dependence on Russia as well. At the same time, the reopening has caused a pick-up in demand, and the gross imbalance of supply and demand has pushed up prices to nearly unprecedented levels.

Since the US government stopped price controls on US crude oil in the early 1980s, there have only been six other periods where WTI prices rose for five or more consecutive months. As you can see from the chart below, half of these occurrences were shortly after the Global Financial Crisis, as prices rebounded from the sharp downturn in prices during the financial collapse, and the most recent was in early 2018.
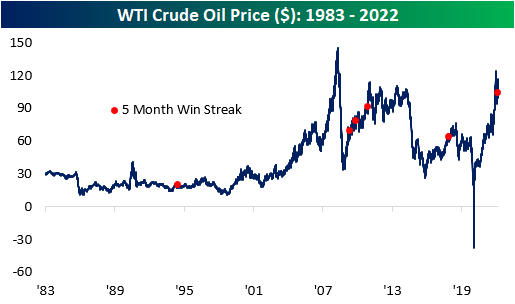
Following five consecutive months of gains in oil, the average performance has been relatively weak compared to historical averages. In the first five months of each streak, oil prices have rallied by an average of 40.9% (median: 38.6%), which is nearly ten times higher than the average of all five-month periods since 1983. However, oil tends to underperform in the near term following these occurrences, registering an average loss of 3.2% and 0.8% over the next week and month, respectively. Notably, this was the only occurrence in which the price of oil climbed higher in both the following week and month, gaining 4.9% and 9.5% respectively. The only period in which the average performance was higher than that of all periods is three months, as oil has averaged a gain of 4.4% after a streak of five months is reached.

The chart below summarizes the performance one year before and after a streak of five months is reached. As you can see, oil has traded most similarly to the late 2009 occurrence, in which the price of oil rose by 15.1% in the following year. Long story short, although the average performance in these time periods is relatively weak, there isn’t a clear trend in performance in one direction or the other. Click here to become a Bespoke premium member today!

Jun 1, 2022
The Energy sector has been on an absolute tear over the pandemic period with a 273% gain since the pandemic lows in March 2020. During the overall market downturn of the past several months, it is the only cyclical sector to have managed to retain its uptrend as it has rallied over 60% year to date compared to a 13% decline for the S&P 500. Taking a look through our Chart Scanner tool, there is not too much variation in the charts of large-cap Energy stocks with strong uptrends across the board and many new multi-year highs as a result. Taking a look at two of the largest members who account for nearly three-quarters of a trillion dollars in market cap, Exxon Mobil (XOM) and Chevron (CVX) are good examples. CVX has reached new all-time highs following its meteoric rise over the past couple of years while XOM has recovered most of the past decade’s declines. Additionally, we would note that XOM has historically tended to be much larger than CVX, but the pandemic and the subsequent rally over the past couple of years have brought the two stocks’ market caps much more closely in line with one another.
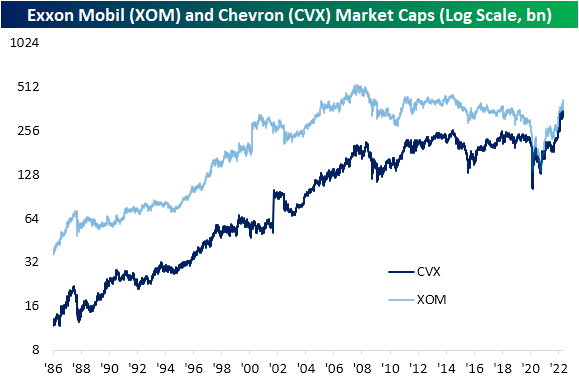
Both long-standing staples of the Energy sector, XOM and CVX are also notable in that they are both dividend aristocrats (a group of stocks that have now raised their dividend annually for 25 or more consecutive years). That means on top of massive capital gains, investors have also been rewarded handsomely with dividends. Even after these massive rallies, CVX still yields 3.25% and XOM pays an even better 3.67%. Taking this into account, the two-year runs including dividends that these stocks have been on are unlike anything observed since at least the early 1980s. Given the record two-year run we’ve seen in the Energy space, it’s tough to get super bullish on this area of the market now. Remember, we saw an explosive move higher like this for other areas of the market earlier on in the post-pandemic era (think meme stocks, SPACs, high growth, etc.), but once the tide turned in late 2021, the downside reversal was just as extreme. Energy stocks have completely different fundamental risk profiles than aggressively valued Tech stocks, and ultimately their performance is mostly tied to the price of oil. That being said, investor psychology and herd mentality work the same regardless of the asset class. Click here to learn more about Bespoke’s premium stock market research service.

May 24, 2022
Bespoke’s Metaverse Index tracks 40 companies with exposure to the continued rollout of the metaverse. We outlined seven components of the metaverse and selected the companies that have either spoken about their metaverse plans or have the capabilities to fulfill metaverse needs within these categories.
Bespoke’s Metaverse Index is available at the Bespoke Premium level and higher. You can sign up for Bespoke Premium now and receive a 14-day trial to read our Metaverse report. To sign up, choose either the monthly or annual checkout link below:
Bespoke Premium – Monthly Payment Plan
Bespoke Institutional – Annual Payment Plan
May 24, 2022
It seems like a distant memory now, but Monday’s rally marked just the 13th time all year (and over the last 100 trading days) that the S&P 500 tracking ETF (SPY) opened higher and traded in positive territory all day (‘100% positive day’). The chart below shows the rolling 100-trading day total number of 100% positive days for SPY since 1994, shortly after the ETF launched. The current level of 13 is already well below the long-term average of 18, but last week, the reading was even lower at 12. The last time the 100-day rolling total was lower than that was in May 2009, and the lowest readings ever recorded were in periods beginning in October 2002 and September 2008 with just six in a 100-trading day span.
What makes the current period unique is how quickly the rate of 100% positive days has plummeted. 100 trading days ago, the rolling total was more than twice the current level at 29. Also, it was only in February 2021 (less than sixteen months ago) that the number of 100% positive days reached a record high of 33 on 2/4/21. That peak came just weeks before the Federal Government sent out the third and final round of stimulus checks. Just as massive amounts of fiscal and monetary stimulus helped to support markets during COVID, the withdrawal of these supports has introduced gravity back into the equation. Click here to learn more about Bespoke’s premium stock market research service.
