Jun 13, 2022
See what’s driving market performance around the world in today’s Morning Lineup. Bespoke’s Morning Lineup is the best way to start your trading day. Read it now by starting a two-week trial to Bespoke Premium. CLICK HERE to learn more and start your trial.
“Come what may, all bad fortune is to be conquered by endurance.” – Virgil

Below is a snippet of content from today’s Morning Lineup for Bespoke Premium members. Start a two-week trial to Bespoke Premium now to access the full report.
It’s not a pretty picture for risk assets of any kind this morning as equity indices around the world are down over 2%, US futures are down by about the same amount, treasuries are selling off hard, and crypto prices are down sharply. Concerns over inflation and its impact on economic growth have become heightened over the last several days, and unlike prior periods in recent history where growth has come into question, with inflation pressures as strong as they are, there is little optimism that the Fed can help to cushion the blow.
In today’s Morning Lineup, there’s a lot covered this morning as we discuss prior streaks of 1%+ and 2%+ declines for the market (pg 4), the plunge in crypto prices (pg 5), overnight movements in the yen (pg 6), action in Asian and European markets (pg 6), overnight economic data in Asia and Europe (pg 7), and much more.
The first trading day of the week has already been weak for the market, but today’s 2%+ downside gap in SPY will be, by far, the largest downside gap to start a week of the year and the largest since March 2020.

Start a two-week trial to Bespoke Premium to read today’s full Morning Lineup.
Jun 7, 2022
The broader retail space has been weak relative to the S&P 500 so far this year. Much of this weakness came after Target’s (TGT) and Walmart’s (WMT) earnings calls, in which management noted margin compression, inventory gluts in certain categories, shifting consumer preferences, and weakness in consumer spending as inflation in food and energy reduces discretionary budgets. Institutional subscribers can view our Conference Call Recaps on these two companies by clicking here. On a YTD basis, the VanEck Retail ETF (RTH) has underperformed the S&P 500 (SPY) by 4.5 percentage points, trading down by 18.2% as of today. A chart of the relative strength of RTH vs SPY over the last year is shown below.

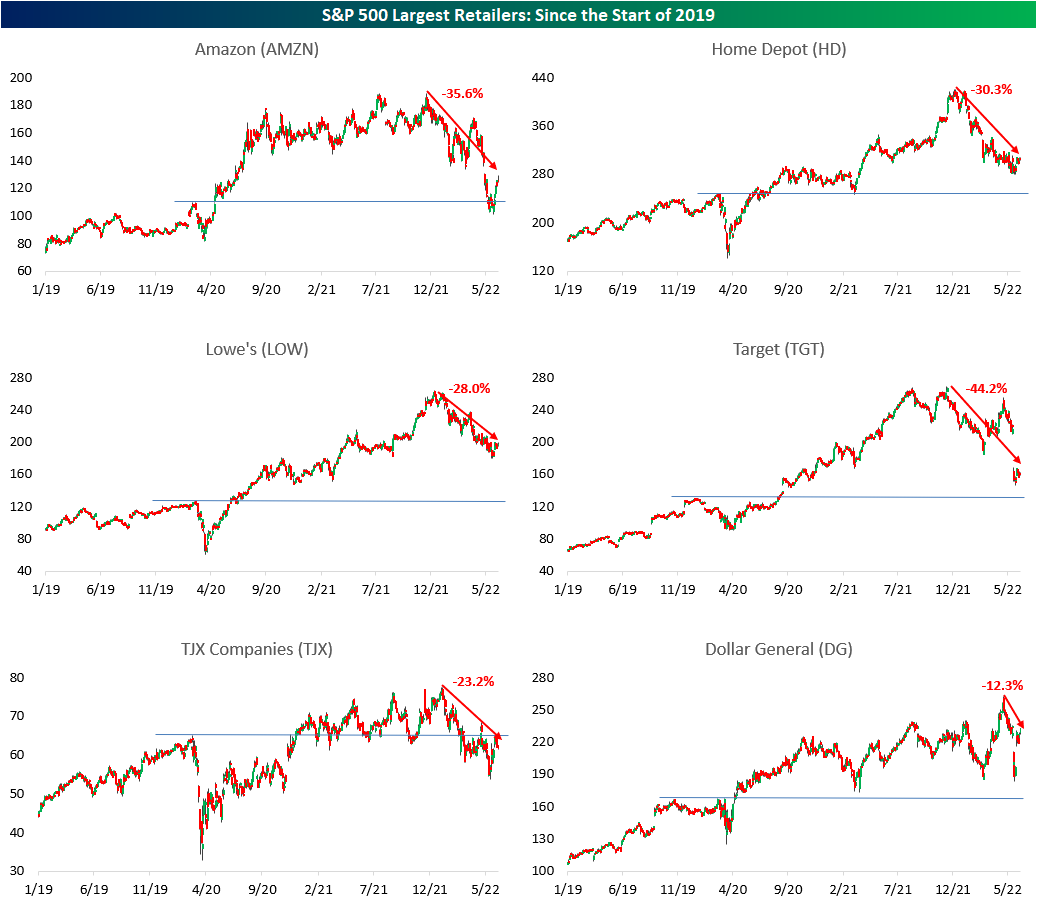
Within the S&P 500, there are 21 stocks that make up the Retailing industry, and in the table below, we have outlined the performance of the 10 largest stocks by market cap. You’ll notice that companies like Costco (COST) and WMT aren’t listed, but that’s because they are actually part of the Food and Staples Retailing industry. As you can see, seven of these ten stocks are down more than the average S&P 500 member on a YTD basis, and six are further from their respective 52-week highs than the average S&P 500 member. However, only two of these stocks are below their pre-COVID highs, whereas more than a third of (35.8%) of S&P 500 components are below their pre-COVID highs.

Below are charts of each of the 10 stocks listed above since the start of 2019. Included on each chart is the percentage that each is off its 52-week high. As you can see, AutoZone (AZO), Dollar Tree (DLTR) and Dollar General (DG) have held up relatively well amidst broader market weakness, likely due to their positioning on the value chain. The market seems to believe that consumers will move down the value chain amidst rising inflation, which makes our latest Little Known Stocks Report even more compelling. Click here to become a Bespoke premium member today!

Jun 2, 2022
It was a mixed morning for labor market data. What could be a bad omen for tomorrow’s Nonfarm Payrolls number, ADP’s monthly payroll report showed the weakest month of job creation since the start of the pandemic. On the bright side, this week’s initial jobless claims number continued to reverse off of recent highs dropping back down to 200K. While the levels from February through April were even stronger, this week’s reading remains impressive nonetheless with the only comparable levels being during the two years leading up to the pandemic as well as all the way back in the late 1960s.
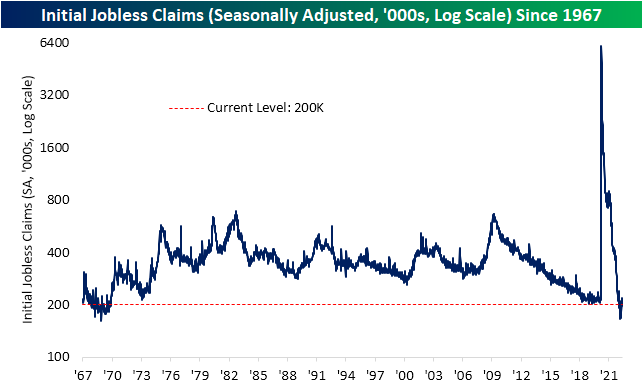
From a seasonal perspective, tailwinds are likely to become headwinds over the next couple of months. As shown in the second chart below, the current week of the year has historically been when unadjusted jobless claims have put in a seasonal low. That is typically followed by several weeks of consistent weekly increases that lead to a short-term peak usually in mid-July. In other words, it should not be surprising to see claims move higher in the weeks ahead, but regardless of any seasonal moves, this week did mark the lowest reading for the comparable week of the year since 1973. That reaffirms the seasonally adjusted reading in that claims are at impressively low levels.

Although initial claims have come off the lows and are likely to keep doing so as seasonal trends shift, continuing claims keep hitting new lows. This week’s reading fell all the way down to 1.309 million from 1.343 million last week. That is now the lowest level since the last week of 1969. Click here to learn more about Bespoke’s premium stock market research service.

Jun 2, 2022
Sentiment has taken a big swing higher across surveys this week as the S&P 500 has experienced some upside mean reversion. The weekly AAII sentiment survey has seen bullish sentiment rebound from a sub-20% reading all the way back up to 32%. Relative to the historical average of 37.84%, that reading continues to show a depressed level of optimism for individual investors, but it is the strongest reading since the week of March 24th. As for the 12.2 percentage point jump in bullish sentiment week over week, it was the largest one week gain since the week of October 14th of last year when it rose 12.4 percentage points.
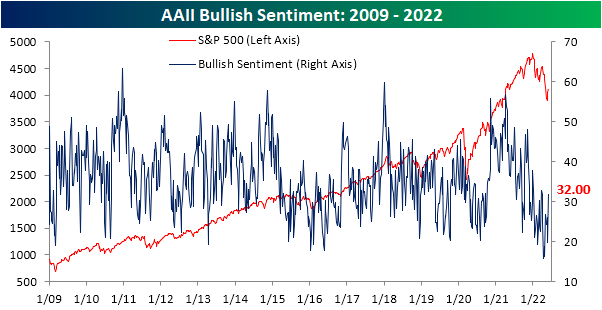
As bullish sentiment surged, there was a massive 16.4 percentage point drop in bearish sentiment. That was the largest one week decline in the reading on pessimism since July 15, 2010 when it fell 19.27 percentage points. Now at 37.1%, bearish sentiment is at the lowest level since the end of March.
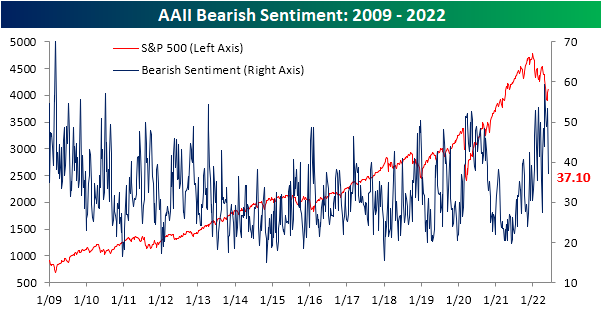
Such a large decline in bearish sentiment in only one week has pretty much been unheard of in the post Financial Crisis years. Again, July 2010 was the last time bears fell by at least 15 percentage points and before that there are only about two dozen other occurrences without another instance in the previous three months. While it was a big decline, bearish sentiment remains fairly elevated at 37.1%, but that is inline with most other occurrences since the mid 2000s whereas bearish sentiment was generally lower from the occurrences before 2005.
As for how the S&P 500 has tended to do following these massive bearish sentiment shifts, the S&P 500 has generally tended to move higher with outperformance versus the norm on a median basis one week and one month out. Although again performance is consistently positive, the size of gains have tended to be below or more inline with the norm three, six, and twelve months out from these occurrences.

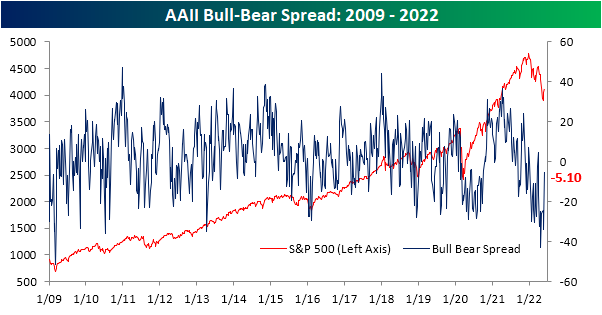
After the large moves in bulls and bears this week, sentiment continues to favor pessimism but to a much smaller degree than recent weeks as the bull bear spread narrowed to -5.1 points. Click here to learn more about Bespoke’s premium stock market research service.
Jun 2, 2022
Although not a widely accepted indicator, we like to look at the number of NICS firearm background checks as a barometer for fear and geopolitical volatility for the United States. In uncertain times (like the beginning of government-imposed COVID lockdowns), background checks tend to spike. Inversely, when times are good, background checks tend to decline. An additional causal factor of background check spikes is the outlook on gun policy. When the public feels as if gun policies are going to become stricter, Americans tend to rush to purchase firearms, which is evidenced by the record y/y increase after President Obama was reelected. Recently, several mass shootings have brought gun control regulations back into the news cycle, so one would expect to see background checks tick higher. Granted, much of this rhetoric really picked up towards the end of the month, so any effects will likely be seen in June (or later) numbers. Nonetheless, background checks declined for the second consecutive month after briefly spiking earlier this year. In May, checks declined by 27.4% y/y to just 2.3 million.

On a YTD basis, background checks have fallen by 30.7%, the largest first five-month decline since at least 2000.

Although the decline is certainly significant, monthly background checks are still comfortably above their longer-term trend line. To summarize, although checks are down significantly y/y, the long-term uptrend that was in place prior to the COVID surge is still largely intact.
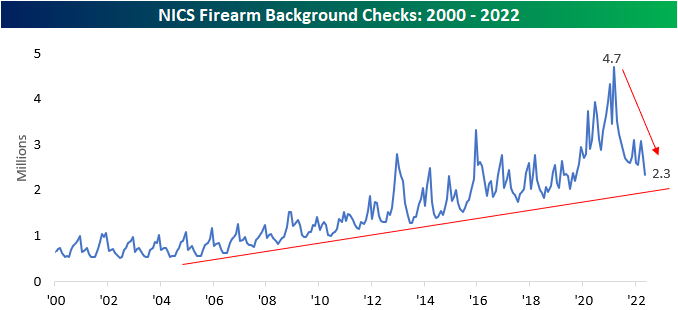
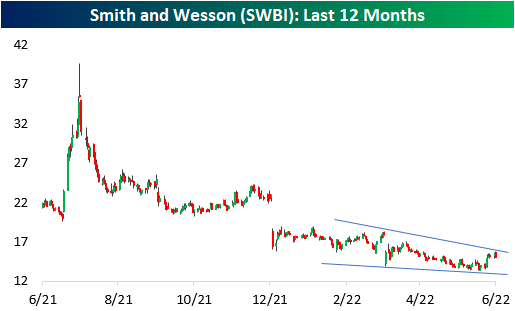
Although we like to think that the market is forward-looking, the price action of gun manufacturer Sturm Ruger (RGR) tends to be highly correlated with the number of background checks over the prior twelve months. Since the start of 2000, RGR’s end-of-month close and the trailing twelve-month background check figure has held a correlation coefficient of 0.90, a near-perfect positive relationship. Therefore, a reversal in the downside momentum of background checks as Americans step up purchases in advance of perceived or actual new regulations in gun ownership would leave room for upside in RGR.

Looking at the last twelve-month price charts of two firearm manufacturers, a relatively similar pattern emerges. RGR and Smith and Wesson (SWBI) are both in sustained downtrends. However, both have seen consolidation as of late, and SWBI is even testing its trendline. The decline has been warranted due to the significant decrease in background checks (and in turn firearm purchases), but a reversal higher in checks would likely provide a tailwind for both companies. Click here to become a Bespoke premium member today!