Apr 12, 2022
Sentiment on the part of small businesses deteriorated further in the month of March as the NFIB’s Small Business Optimism Index dropped 2.5 points to 93.2. That took out the January 2021 level for the weakest print for the index since the start of the pandemic in the spring of 2020.

Considering the headline index is only a couple of points above the pandemic low, last month’s reading is only in the 16th percentile of all months on record going back to the start of the report in 1986. The month-over-month decline was also historically large ranking in the bottom decile of all monthly changes. The same could be said for multiple other categories. For example, expectations for the economy to improve and expectations for higher real sales came in at or close to record lows as the month-over-month declines were in the bottom 2% of all monthly moves. This downbeat sentiment was a complete disconnect from the levels of actual sales changes (more on this below). On the other hand, there is a wide variation across categories with top decile readings for several indices like plans to increase employment, current inventories, job openings hard to fill, and compensation-related indices.

Many of the strongest readings of the report are related to employment. Plans to increase employment have pulled back significantly from pandemic highs and are back within the range of readings from the few years prior to the pandemic. Regardless, March’s reading was in the top decile of historical readings. Actual reported changes to employment, however, have continued to fluctuate around zero and were negative in March meaning small businesses saw a decrease in hiring. That lack of hiring comes as businesses continue to report historic difficulty in filling open roles. This reading too has been rolling over though. That is echoed by fewer businesses reporting the cost or quality of labor as their single biggest concern. That combined reading has fallen from a high of 40% in September of last year to only 30% today. As other issues (namely inflation) have taken precedent as the main concern of small business owners, cost of labor remains elevated with near-record but peaked readings in compensation and compensation plans.

As employment metrics remain elevated but show signs of rolling over, readings on expectations for general conditions and sales remain weaker. Outlook for general business conditions stands out as the weakest reading of the report as the index dropped another 14 points in March to set the bar even lower for a record low. Given the pessimism surrounding business conditions, the share of businesses reporting now as a good time to expand fell for the third month in a row to match the February 2021 low. One likely reason for the aforementioned pessimism is soaring prices shown through yet another record high set by the higher prices index.
Not only has the outlook for general business conditions soured, but so too have sales expectations. Small businesses reported the worst expectations for sales since the spring of 2020. The only other period in the history of the data going back to 1986 with as weak of an optimism reading for sales was during the Great Recession. That stands in stark contrast with the actual reported sales changes. Small businesses actually reported positive momentum for sales, though, higher costs are likely eating into profitability as actual earnings changes went unchanged at deeply negative levels. In the release, the NFIB highlighted that of those respondents who reported lower profits, 35% blamed higher material costs and 13% reported higher labor costs. Another 23% blamed weaker sales. Click here to view Bespoke’s premium membership options.

Apr 12, 2022
It was a little more than a year ago that we remember reading the following article in The Wall Street Journal and articles like it all over the place:
The gist of it was that COVID pushed older Americans out of the labor force in droves, and many of them weren’t coming back. This exodus from the labor force would have major societal implications as it would weigh on overall economic growth, decrease worker productivity, and push labor costs higher. As one economist in the article noted, “Historically, the likelihood of seeing workers who decided to retire come back into the labor force is quite low, so we do think that some of the drop in the participation rate with older workers is likely to remain permanent.”
What a difference a year makes. While inflation, which was supposed to be transitory, has ended up looking a lot more permanent, it appears as though the exodus of older Americans from the labor force, which was initially thought to be permanent, may end up being more transitory in nature. The Wall Street Journal highlighted this trend today:

While it may not be for the best reasons, many older Americans who left the labor force when COVID hit found that after accounting for inflation at multi-decade highs, their nest eggs will not be as supportive of their retirement plans as they originally thought, and that’s pushing them back into the labor force.
While the implication of workers leaving the labor force was for slower growth, lower productivity, and higher labor costs, an influx of workers should increase growth, increase productivity, and put downward pressure on labor costs. It’s all about supply and demand. The reason for workers returning back to the labor force may not be the most favorable for them, but amazingly, the exodus of older Americans from the labor force didn’t even last as long as the “farewell’ tours from the Eagles or The Who! Click here to try out Bespoke’s premium research service.
Apr 12, 2022
See what’s driving market performance around the world in today’s Morning Lineup. Bespoke’s Morning Lineup is the best way to start your trading day. Read it now by starting a two-week trial to Bespoke Premium. CLICK HERE to learn more and start your trial.
“In spite of the cost of living, it’s still popular.” – Kathleen Norris
The CPI report that everyone was waiting for has finally arrived and as is usually the case when everyone expects the worst, the results weren’t as bad as feared (although they’re far from good). On a headline basis, CPI rose 1.2% m/m which was right in line with forecasts. Core CPI, however, rose ‘just 0.3%’ compared to forecasts for a gain of 0.5%. Given the weaker than expected core reading, futures have shot higher with the Nasdaq up nearly 1%. As equities have rallied, Treasury yields are falling but still high even relative to where they were last week!
Make no mistake, these readings are still very high relative to recent history. For example, backing out the period since 2020, the 0.3% increase in m/m Core CPI would have been the highest since March 2006. Compared to recent trends and what people were expecting, though, this morning’s report was a positive surprise.
Read today’s Morning Lineup for a recap of all the major market news and events from around the world, including the latest US and international COVID trends.
We all know that recent inflation data has been high, but the consistency of upward pressure has been incredible. It’s a popular narrative that the Fed is behind the curve, but they’re not the only ones. Economists have simply not been able to catch up and get ahead of the persistent trend of rising prices. The chart below shows the rolling 24-month total of the weaker than expected m/m headline CPI reports going back to 2000.
During this span there have only been three months where headline CPI came in weaker than expected. Three!. Going back to 2000, there has never been a period where weaker than expected CPI reports were as scarce as they have been in the last two years.

Start a two-week trial to Bespoke Premium to read today’s full Morning Lineup.
Apr 11, 2022
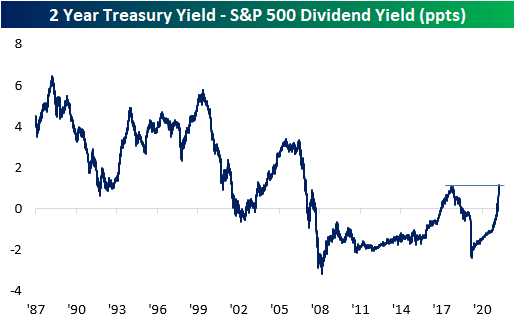
Since mid to late-2019 when interest rates really started to fall, the dividend yield on the S&P 500 consistently provided a higher yield than the two-year US Treasury. With a higher payout plus the potential for price appreciation, equities looked more attractive to many investors. The period from the Financial Crisis through 2017 also saw a similar setup where the S&P 500’s dividend yield was higher than the yield on the 2-year, but before the Financial Crisis and the FOMC’s zero-interest-rate policy, it was extremely uncommon for the S&P 500 to yield more than the two-year Treasury. This year has caused a tidal shift in the balance of power in yield between the S&P 500 and the two-year Treasury. As the Fed came to the conclusion that inflation wasn’t as transitory as originally thought and found itself behind the inflation curve, it shifted from a much more accommodative stance to one that was more biased towards tightening, and that shift resulted in one of the most rapid increases in two-year Treasury yields in decades. In the process of this spike in rates, back in February, the yield on the two-year rose back above the dividend yield of the S&P 500 for the first time since 2019.

As Treasury yields have continued to spike, the premium in yield of two-year Treasuries relative to the dividend yield of the S&P 500 reached an important milestone last Friday (4/8). As shown in the chart below, the spread between their yields widened out to 110 basis points (bps), taking out the high of 108 bps from 2018. At these levels, the spread between the two is now the widest it has been in fourteen years since the Financial Crisis. It started with long-term Treasury yields, but as the overall trend in rates has been higher, most of the Treasury yield curve is now yielding more than the S&P 500. For years now, investors have had a TINA (There Is No Alternative) relationship with the stock market, but as interest rates have shot higher, TINA is taking a backseat to BABY (Bonds Are Better Yielders). Click here to try out Bespoke’s premium research service.
Apr 11, 2022
Earnings season kicks off this week as the major banks and brokers start to report their first-quarter numbers. BlackRock (BLK) and JP Morgan Chase (JPM) will kick things off on Wednesday, followed by Citigroup (C), Goldman Sachs (GS), and Morgan Stanley (MS) leading the charge on Thursday. On Friday, the equity market is closed in observance of Good Friday, but Bank of America (BAC), Bank of New York (BK), and Charles Schwab will all report next Monday (4/18). While it will be a busy few days for Financials, the heart of earnings season doesn’t really get rolling until later this month. The five largest companies in the S&P 500 (AAPL, AMZN, FB, GOOGL, and MSFT) won’t report until the last week of April.
For a more detailed rundown of the earnings schedule for the upcoming season, please see our Earnings Explorer Tool (available to all Institutional clients) on the Tools section of our website, and to see our quarterly preview of the upcoming earnings season with respect to analyst sentiment heading into it, start a two-week free trial to either Bespoke Premium or Bespoke Institutional.
