May 4, 2022
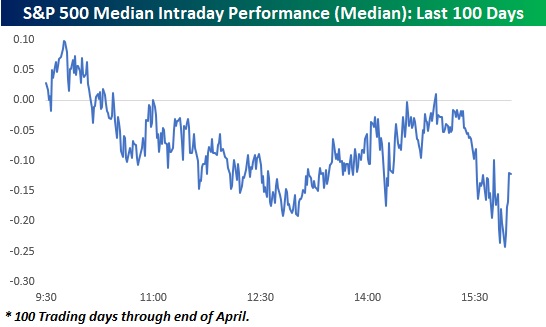
If it seems to you like the market simply can’t hold on to gains this year, you aren’t mistaken. The chart below shows an intraday composite of the S&P 500 on a median basis over the last 100 trading days through the end of April. The general pattern during this period has been for the market to open modestly higher, but then sell off for the remainder of the morning. It has then regained its footing shortly after mid-day but then sells off into the close.
How does the last five months or so compare to history? The charts below really put the recent trend of intraday weakness into perspective.
The first chart shows the number of days over a rolling 100-trading day period that the S&P 500 tracking ETF (SPY) traded in positive territory on an intraday basis but finished the day down. The reading currently stands at 38 and was as high as 40 (red line) in the last week of April. As shown in the chart below, there hasn’t been another period that the S&P 500 has had so much trouble holding onto intraday gains in more than a decade (October 2010)!

For the Nasdaq 100 (QQQ), it has been a similar story. As recently as April 22nd, the trailing number of times in the last 100-trading days that QQQ traded in positive territory on an intraday basis but finished the day lower reached 42 and currently stands at 40. Like SPY, the recent reading of 42 was the highest number of occurrences in a 100-trading day span since October 2010.
For both indices, the currently elevated frequency of giving up intraday gains has been extremely uncommon for the post-financial crisis period. Interestingly enough, though, in the ten years before the financial crisis, these types of periods were a lot more common, especially for the Nasdaq. Could it have anything to do with the fact that the last 12 years have also been one of the more accommodative monetary environments investors have ever experienced? Click here to learn more about Bespoke’s premium financial markets research.

May 3, 2022
The S&P 500 (SPY) is down nearly 4% since the last FOMC meeting on March 16th when the Fed lifted off of the “zero bound” by hiking rates 25 basis points. As we approach the second rate hike of this cycle tomorrow, below is a snapshot of recent asset class performance using our key ETF matrix. For each ETF, we show its total return since the close on the date of the last FOMC meeting (3/16) as well as its total return since February 19th, 2020, which was the stock market’s closing high prior to the start of the COVID pandemic.
Starting with performance since the Fed hiked rates for the first time back in March, we’ve seen across-the-board declines in US equities with the exception of a few sectors. Small-caps and the Nasdaq have been hit hardest since the March rate hike, while the Dividend ETF (DVY) has managed to post a small gain. Communication Services and Financials have been the hardest hit sectors with declines of 8%+, while Energy and Consumer Staples are both up more than 5%. Outside of the US, not one country ETF is up since the Fed hiked rates, and Germany and China are both down ~10%. The China ETF (ASHR) is down more than any ETF in our matrix since the first rate hike, but the 20+ Year Treasury ETF is right on its heels with a decline of 10.1%. Even gold and silver are now down since 3/16, while energy and agricultural commodities are in the green.
As asset prices have fallen in 2022, we’ve seen quite a few areas of financial markets really start to give up post-COVID gains. The S&P 500 has still posted a total return of nearly 28% since pre-COVID, but the small-cap Russell 2,000 is up less than 15% at this point. Looking at US sectors, Energy is up the most since 2/19/20 with a gain of 61%. Materials and Technology are still up 40%+, while Industrials and Financials are up just 18%. Two sectors — Utilities and Communication Services — have posted total returns of less than 10% since the pre-COVID high.
Outside of the US, India and Canada are both solidly green since the pandemic began, but countries like Brazil, Germany, Hong Kong, Italy, and Spain are all in the red. Commodity ETFs have been some of the best since the pandemic, although USO (oil) specifically is actually down 14% since the close on 2/19/20.
Treasury ETFs are down on a total return basis since pre-COVID, with TLT down the most at 15%. The only bond ETF that has offered some protection post-COVID is the inflation-protected TIP, which is up 8.42%. Click here to learn more about Bespoke’s premium financial markets research.

May 3, 2022
The sell-off in bond prices over the last six months has been extreme to say the least. There are a number of ways we could highlight the carnage for bond investors, but one way is to look at how far bond indices are trading below their 200-day moving averages. As shown below, the Bloomberg US Aggregate Bond Market Total Return index is currently 8.5% below its 200-day moving average.

Going back to 1988 when daily price data begins, the 200-DMA spread is currently 2x more negative than any prior extreme oversold reading. Click here to learn more about Bespoke’s premium financial markets research.

May 2, 2022
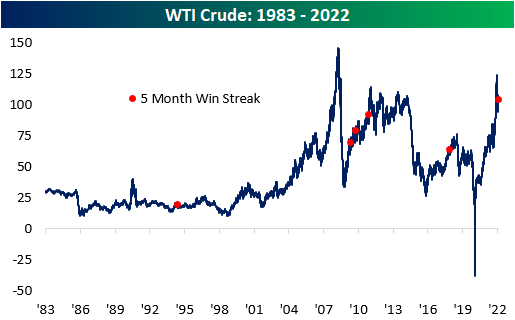
It’s been a monster year for cruse oil and it continued in April. For the month, WTI rallied 4.4% and finished the month at $104.7 per barrel. This comes as Russian supply has been essentially cut off from Western markets, the Saudis hold back supply, and US drillers are in the process of ramping up capacity to meet demand, which is a process that takes several months to complete. Most notable about April’s rally was that it marked the fifth consecutive month in which WTI rallied, which is tied for the second-longest streak on record (since 1983). The only streak that was longer was in late 2010/early 2011 when WTI notched eight straight months of gains.

The chart below outlines the long-term price chart of WTI Crude. Two aspects stand out in the chart. First, crude oil tended to see additional gains in the short term following these five-month streaks. Secondly, it is also worth noting that three of these occurrences happened within two years (2009 – 2011), which was likely due to aggregate demand ticking higher as the economy emerged from the Global Financial Crisis. The current period is relatively similar, as the global reopening has put upward pressure on the demand curve after oil producers lowered output during COVID. That increased demand has also been exacerbated by supply constraints following the Russian invasion of Ukraine.
The table below outlines the performance of WTI after the fifth straight month of prior five-month win streaks. WTI tended to trade down over the following month but reversed course to book gains in the following three and six months. In the month following these streaks, WTI averaged a loss of 4.4% (median: -4.8%), booking gains just one time (20%). After three months, WTI averaged a gain of 5.1% (median: 5.5%), performing positively 80% of the time. Over the next six months, average performance and positivity rates declined to 1.9% and 60%, respectively.
Higher oil prices affect energy prices, shipping rates, and the cost of so many more secondary products. Therefore, higher oil prices tend to be inflationary and crimp corporate margins as well as consumer buying power. Historically speaking, though, the S&P 500 has averaged a gain of 8.3% (median: 12.1%) during these streaks, which is 420 basis points higher than the average performance for all five-month periods since 1983. In the month following these streaks, the S&P 500 has averaged a gain of 1.4% (median: 3.2%), which is higher than the historical average as well. In the next three months, the index has averaged a gain of 4.5% (median: 4.9%) with positivity rates higher than that of all periods. Similar to what we see in the six-month performance of WTI, positivity rates moderate for the S&P 500, with average six-month gains of 3.2% (median: 0.2%) versus around 5% for all six-month periods since 1983. Click here to view Bespoke’s premium membership options.

Apr 29, 2022
Amazon (AMZN) was one of the primary beneficiaries of the pandemic as consumers were forced to engage in commerce digitally and corporations became increasingly willing to migrate to the cloud. In the first year or so after the March 2020 COVID Crash, AMZN shares soared from $2,000 up to $3,700. Since peaking in mid-2021, however, it has been a different story. Since AMZN reported earnings last night, shares have fallen another 15%. This leaves AMZN up just 13.5% from the level it was trading at right before the pandemic began on 2/19/20.
Although the stock is now barely higher versus pre-COVID levels, revenues continue to climb. Relative to pre-pandemic levels, trailing 12-month revenues have increased by 70.3% (CAGR of 27.2%). As implied, the price to sales multiple has compressed considerably relative to pre-pandemic levels. At the highs, AMZN was trading 3.8 times sales. The highest P/S multiple for the stock since the start of 2020 occurred in September of 2020, when the multiple hit 5.5. As it currently stands, the price to sales multiple is at new lows relative to the start of 2020 at just 2.7.

While AMZN revenues are up 70% from pre-COVID levels, margins have compressed considerably. In Q1 2020, AMZN posted operating margins of 9.5%. In Q1 2022, AMZN reported operating margins of 3.2%. These results can be attributed to inflationary pressures, labor challenges, supply chain constraints and foreign exchange headwinds. As you can see in the chart below, margin compression has hampered EPS, resulting in a decline in trailing 12-month EPS over the last three quarters. Relative to pre-pandemic levels, EPS have risen by 52.5% (CAGR: 21.1%), but they’ve declined by 38.8% over the last three quarters. Click here to become a Bespoke Institutional subscriber and gain access to our Conference Call Recaps.
