May 16, 2022
In an earlier post, we noted the dramatic underperformance of IPOs in the past year using the Renaissance IPO ETF (IPO) as a proxy for newly listed companies. One downside of using the IPO ETF is that it only began trading in 2013. To get a gauge on IPOs going further back, below we have created an index using the Bloomberg IPO index starting in August 1994 through October 2017 when it was discontinued, then switching to the performance of the IPO ETF in the time since then. The two measures of IPOs are not perfectly like for like given differences in methodology (for example, the Bloomberg index only tracked companies that debuted in the past year versus three years for IPO), but combining the two still helps us compare the current drawdown versus prior ones dating back to the early 1990s.
Since peaking with the rest of the most aggressively valued stocks in early 2021, IPOs as a group are in a 60%+ drawdown! While we’ve seen multiple drawdowns of at least 30% for IPOs over the years (during the Financial Crisis, the late 2018 sell-off, and the COVID Crash), the current drawdown has been bigger than any period except for the Dot Com bust from 2000-2002. In case you weren’t aware of how painful the declines have been in “growth” areas of the market like IPOs, one look at the second chart below should do the trick. Click here to learn more about Bespoke’s premium stock market research service.

May 16, 2022
Today we published our newest Top Triple Plays report. This season we identified 11 earnings triple plays that may be worth taking a closer look at.
What is a triple play? When a stock reports quarterly earnings, it registers a “triple play” when it beats analyst EPS estimates, beats analyst revenue estimates, and raises forward guidance. We coined the term back in the mid-2000s, and you can read more about it at Investopedia.com. We consider triple plays to be the cream of the crop of earnings season, and we’re constantly finding new long-term opportunities from this basket of names each quarter. You can track the newest earnings triple plays on a daily basis at our Triple Plays page if you’re a Bespoke Premium or Bespoke Institutional member. To read our newest report and see the triple plays that we think look the best right now, start a two-week trial to Bespoke Premium!

May 16, 2022
May’s first reading on regional manufacturing activity out of New York showed significant deterioration. The New York Fed’s Empire State Manufacturing survey’s headline index dropped from a solid reading of 24.6 last month down to -11.6 in May. That is only slightly above the low from two months ago that had marked the first significant contraction in activity since the spring of 2020.

Not only are General Business Conditions back into contractionary territory, but the double-digit negative reading sits in the bottom decile of all months on record going back to the start of the index in 2001. That compares to last month’s reading which was just shy of the top decile. Given the total reversal within the historical range, the month-over-month decline of 36.2 points is now the second-largest one-month drop on record behind the 56.7 point decline in April 2020.
Only New Orders and Shipments fell enough to reach contractionary levels this month, but most other categories also saw large month-over-month declines. Expectations similarly saw broad declines, however, the categories that saw the biggest deteriorations in current conditions (General Business Conditions, New Orders, and Shipments) saw improvements in six-month expectations.
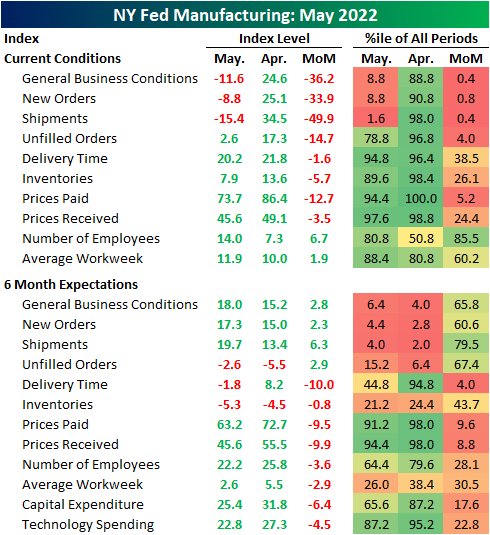
As previously mentioned, the most shocking declines were in demand-related categories, namely New Orders and Shipments. These two indices fell by 33.9 and 49.9 points, respectively. For New Orders, that was the third-largest decline on record outside of the 56-point drop in April 2020 and a 43.1-point decline in the wake of September 11, 2001. The only larger decline in Shipments happened, again, in April 2020. Unfilled Orders also fell dramatically, though the month-over-month decline was not as close to a record, and the actual level of the index is still relatively elevated in the top quartile of its historical range. Although more New York area firms reported declines in new orders and shipments, expectations were each higher month-over-month following sharp declines leading into this month’s report.

Perhaps in part due to that slow down in demand, Delivery Times continue to decelerate with the index dropping another 1.6 points. That follows a much larger double-digit decline in April. In what could be either a positive sign as a result of finally alleviated supply chains or a negative sign given slowing demand, responding firms also reported that they expect delivery times to finally decline in six months. That was the first negative reading in expectations since October 2020.

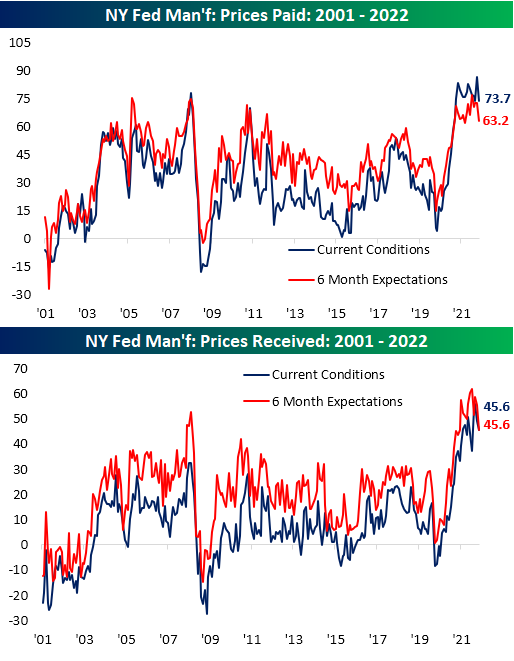
Additionally, inflationary pressures appear to be easing as both indices for Prices Paid and Received declined across current conditions and 6-month expectations. Those declines are only small dents in what have been extremely strong runs over the past two years.
Perhaps the only silver lining in this month’s report was in regards to employment. New York area firms accelerated both net hiring and the average workweek. Again though, expectations were less optimistic as those indices continue to roll over alongside plans for Technology Spending and Capital Expenditures. In other words, the employment situation may have improved in May, but that is not expected to improve dramatically in the months ahead as demand has weakened. Click here to learn more about Bespoke’s premium stock market research service.

May 13, 2022
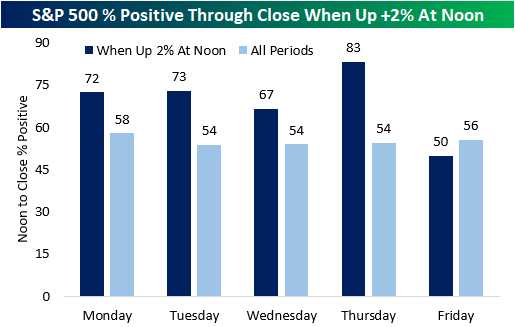
After a tumultuous week, the S&P 500 gapped higher this morning and continued to rip throughout the morning. As of noon, the S&P 500 was up 2.2%, a much-needed rally after a week of pain. Since the start of 1983, the S&P 500 has been up by 2%+ at noon 110 different times, 22 of which have occurred in the pandemic era. There has been only one occurrence this year (3/9) and two in 2021 (3/1/21 and 12/7/21). On a median basis, the S&P 500 averages a noon-to-close gain of 54 basis points (bps) when it rallies 2%+ in the morning, which is over ten times the median of all periods (5 bps). However, looking at just Friday occurrences, the S&P 500 has had a median drawdown of 9 bps from noon to the close, which is 11 bps weaker than that of all periods. Additionally, Friday was the only weekday with median noon-to-close returns below that of all periods when the index had gained at least 2% by noon.

Friday is also the only day of the week with lower than average positivity rates following 2%+ morning rallies. Thursday is the strongest with a positivity rate of 83%. Overall, the index has performed positively from noon to close 70% of the time following these occurrences. click here to become a Bespoke premium member today!