May 19, 2022
Growth stocks outperformed value stocks by a wide margin in the years leading up to the pandemic. Growth also outperformed value in the first ~18 months after the pandemic, but that trend has been flipped on its head since late 2021. You can see the recent convergence between growth and value in the chart below. Entering 2022, the S&P 500 Growth index was outperforming the S&P 500 Value index by ~40 percentage points since the pre-COVID high for the stock market in February 2020. Now, Growth is only outperforming Value by ~8 percentage points.

The shift from growth to value has been even more dramatic in the more economically sensitive small-cap space. Remarkably, the Russell 2,000 Growth index is now DOWN 6% on a total return basis since the pre-COVID peak for stocks on 2/19/20. Six months ago, this index was still up 45% from its pre-COVID high.
Fed Chair Powell first shifted to a tighter monetary stance in November 2021. In just six months since Powell’s pivot, we’ve seen the entire post-COVID bull market for small-caps give up its gains and then some. And this doesn’t even factor in a double-digit percentage point increase in inflation since COVID began that pushes “real” returns for the Russell 2,000 Growth index much deeper into negative territory. Click here to learn more about Bespoke’s premium stock market research service.

May 19, 2022
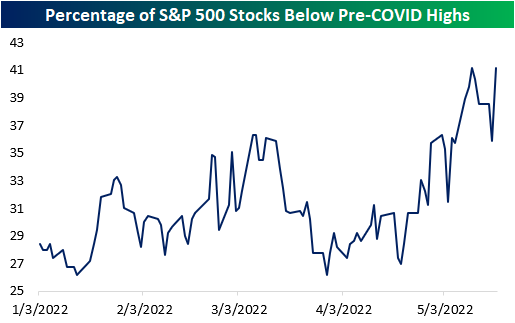
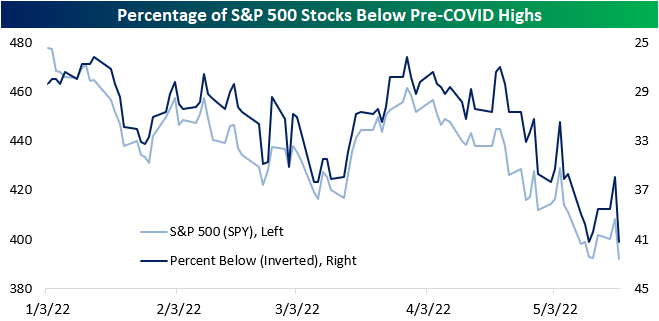
Last week, we outlined the percentage of stocks in each S&P 500 sector that had fallen below their pre-COVID highs to show that many of the stocks that surged due to pandemic effects have significantly fallen off, netting long-term holders a negative return since the onslaught of the pandemic. (Read it here.) Yesterday, the S&P 500 fell by over four percent to set a new 52 week low, breaking the 4,000 level. The index is still up over 15% relative to its pre-COVID high, but as of yesterday’s close, 41.2% of S&P 500 members were below their respective pre-COVID highs, as 26 members crossed below this critical level yesterday.
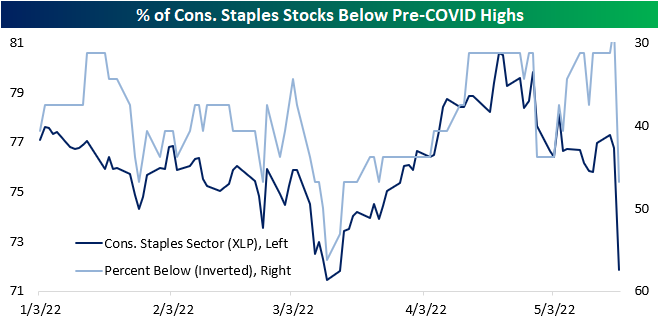
Notably, six of the 32 S&P 500 consumer staples stocks crossed below, moving the percentage from 28.1% to 46.9% on the back of weak earnings reports from Walmart (WMT) and Target (TGT). 66.7% of Communication Services stocks and 60.0% of Real Estate stocks in the S&P 500 are below their pre-COVID highs, but only 18.5% and 23.8% of Materials and Energy stocks are below this level, respectively. Additionally, 8.2% of S&P 500 members were within 5% of their pre-COVID highs, and 15.1% are within 10%.
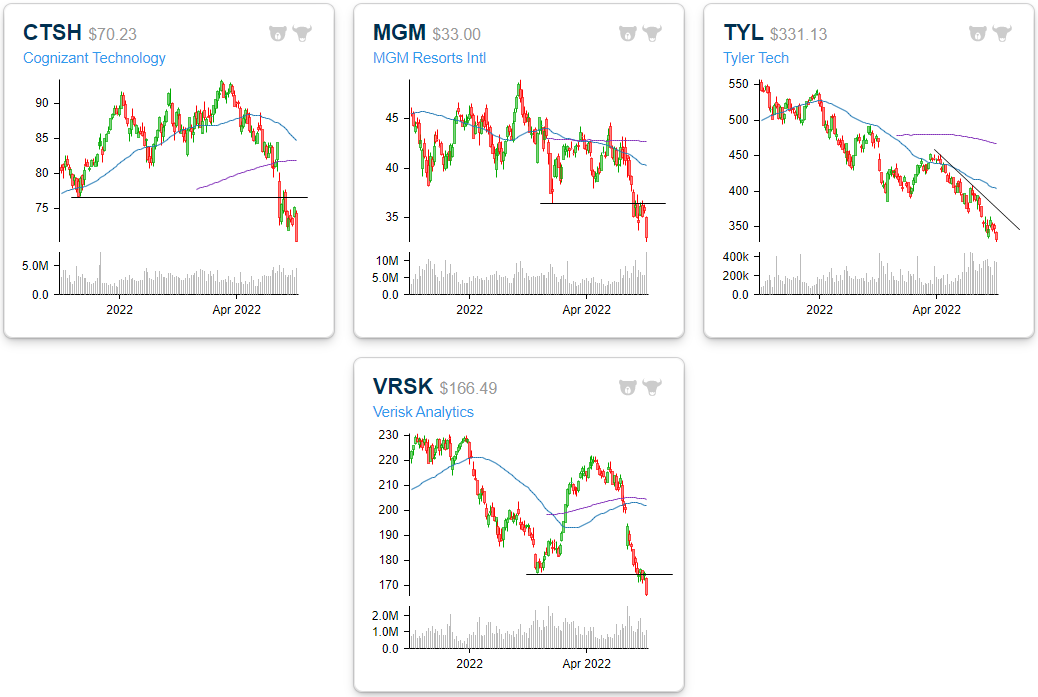
Four S&P 500 stocks crossed below this critical level for the first time in a while yesterday: Cognizant Technology (CTSH), MGM Resorts (MGM), Tyler Tech (TYL) and Verisk Analytics (VRSK). This comes amidst weakness in the Technology sector (XLK) versus the broader S&P 500, as the sector is down close to 25% on a YTD basis versus the S&P 500’s drawdown of about 18%. However, XLK is still up close to 30% relative to pre-COVID highs.
Additionally, there are three stocks that entered a 2% channel above their pre-COVID highs for the first time in a while. Dexcom (DXCM) entered the channel amidst weakness in the broader energy space, and Pentair (PNR) extended the downtrend that is yet to break. Walmart (WMT) sold off significantly in two consecutive days after a weak earnings report and is now less than 1% from its pre-COVID high. A month ago WMT was 30% above this level. Click here to become a Bespoke premium member today!

May 18, 2022
On the same day that mortgage applications plunged 12% and one day after homebuilder sentiment for the month of May showed a large decline, the latest updates on Housing Starts and Building Permits showed a mixed picture. While economists were expecting both reports to decline, the drop in Housing Starts was more than expected while the decline in Building Permits was slightly less than forecast.
The table below breaks down this month’s report by type of unit and region and shows both the m/m and y/y changes. For Housing Starts, the 0.2% m/m decline was driven entirely by single-family units (-7.3%) while multi-family units surged 15.3%. With respect to Building Permits, we saw a similar breakdown although the disparity wasn’t nearly as large as single-family units dropped 4.6% while multi-family units declined just 1%. On a regional basis, the Northeast and Midwest experienced 20%+ declines on a m/m basis while every region except the South experienced declines in Building Permits.
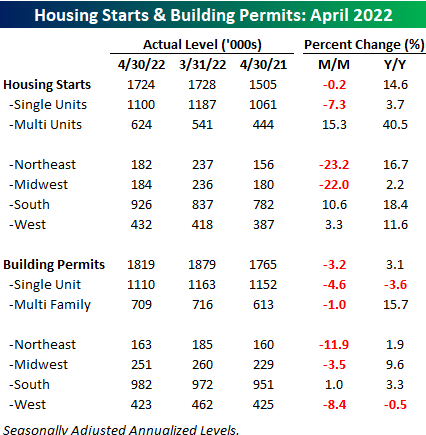
While both Housing Starts and Building Permits declined on a m/m basis, the longer-term trend for both still remains intact. At 1.759 million, the 12-month average of Building Permits came in at the highest level since January 2007 while the 1.659 million average level of Building Permits was the highest since February 2007. Higher interest rates have caused a slowdown in housing at the margin, but longer-term trends have yet to show signs of rolling over. Click here to learn more about Bespoke’s premium stock market research service.

May 18, 2022
See what’s driving market performance around the world in today’s Morning Lineup. Bespoke’s Morning Lineup is the best way to start your trading day. Read it now by starting a two-week trial to Bespoke Premium. CLICK HERE to learn more and start your trial.
“Inflation is a form of tax, a tax that we all collectively must pay.” – Henry Hazlitt

Below is a snippet of content from today’s Morning Lineup for Bespoke Premium members. Start a two-week trial to Bespoke Premium now to access the full report.
This week the tax of inflation is being felt most by retailers as two of the nation’s largest retailers have gotten absolutely destroyed in the last two days. Futures are indicated lower this morning, but one could make the case, given the plunge in Target (TGT) shares this morning, that it could even be worse. Oil prices are also trading up close to 2%, the ten-year yield is back up to 3%, and the dollar is trading lower.
On the economic front, we’re about to get the latest updates on Housing Starts and Building Permits for April, but if mortgage data is any indication, the data isn’t likely to be very strong.
In today’s Morning Lineup, we recap the continued developments in retail earnings (pg 4), market action in Asia and Europe (pg 4), economic data in Asia and Europe (pg 5), and a lot more.
If you thought yesterday’s 11% pounding of Walmart (WMT) was bad, meet Target (TGT). After reporting significantly weaker than expected earnings on better than expected revenues, shares are trading down more than 20% in the pre-market. The company blamed ‘unexpectedly high costs’ that it faced throughout the quarter for the earnings miss, and didn’t provide much additional detail in its release. Investors aren’t waiting for further clarity, though. With margins falling more than 400 basis points (bps), the stock is trading down more than 20% in the pre-market and is easily on pace for not only its worst earnings reaction day in at least 20 years, but also its worst one-day drop since the 1987 crash.
Yesterday, WMT had its largest one-day decline since the 1987 crash and now TGT is on pace to do the same! The experiences of both companies further reinforce the point that we are operating in one of the most complicated macro environments that any company or investor has had to deal with. Few companies are so entwined into so many aspects of the US economy as WMT and TGT, and their logistics and supply chain operations rival or exceed those of most other companies. If they’re having these types of issues keeping up with the rapidly changing environment, who isn’t?


Start a two-week trial to Bespoke Premium to read today’s full Morning Lineup.
May 17, 2022
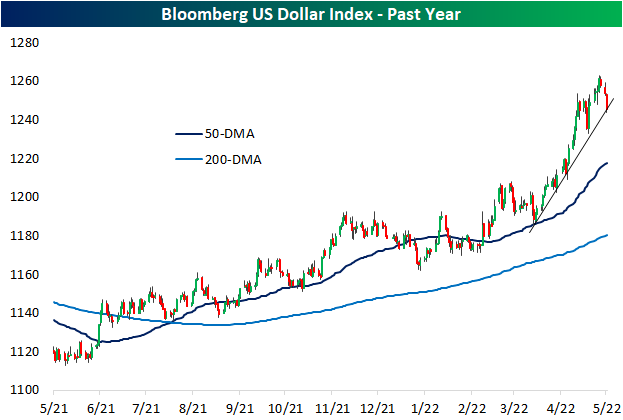
The US dollar has surged amidst the weakness in risk assets in 2022. While also part of a longer-term and more gradual uptrend over the past year, in the past couple of months the Bloomberg Dollar Index has seen its uptrend steepen significantly. Since the last retest of its 50-DMA at the end of March, the dollar was up over 6% through the closing high last Thursday. To round out last week and start this week, the dollar has pulled back sharply with a 1.25% decline. While that may not sound like much, it ranks in the third percentile of all 3-day moves going back to the start of the index in 2005.
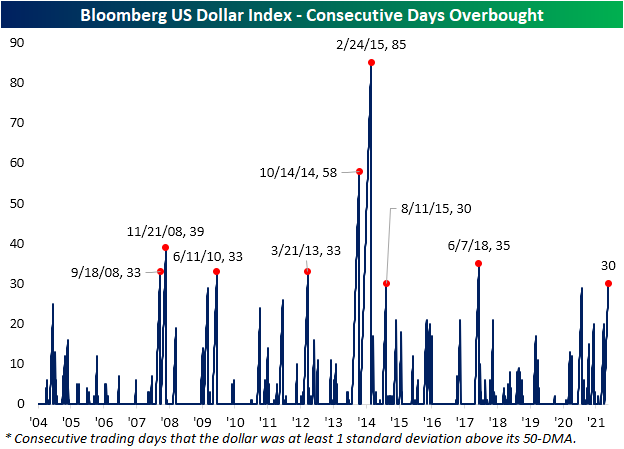
At the moment, the dollar is testing the aforementioned steep uptrend off the late March low. Assuming that the uptrend or any recent lows do not provide support, the dollar has much further to go until it would test its 50-DMA. In fact, the dollar would currently need to fall another 2.28% to reach its 50-DMA as it has consistently traded well above that moving average for multiple weeks in a row. As shown in the second chart below, the dollar recently hit some of the most overbought levels of the past five years, and the long stretch of days with overbought (1+ standard deviation above its 50-DMA) readings has continued.

While recent declines have put the streak on the ropes, today marks the 30th consecutive trading day that the dollar has been at least one standard deviation above its 50-DMA. Going back through the history of the index, there have only been 8 other streaks that have also gone on for at least 30 trading days. The most extended of these ended in February 2015 at 85 days long. The next longest only occurred shortly before that in October 2014.
Additionally, given the dollar has been pulling back, it could be reasoned that stocks with heavy domestic exposure would underperform relative to those with more international exposure. Since last Thursday, that has largely been the case. In the chart below, we have broken down the Russell 1,000 into deciles based on their share of revenues generated from abroad. The first decile is composed entirely of stocks with 100% of revenues generated within the US while the tenth decile is the stocks with the most international exposure. That tenth decile has seen notable outperformance with an average gain of nearly 6% versus an average of 4.2% for all other deciles. The eighth and ninth deciles have also averaged stronger returns than most other groups while the worst performance comes from the first decile, the 100% domestic stocks. Click here to learn more about Bespoke’s premium stock market research service.
