May 24, 2022
See what’s driving market performance around the world in today’s Morning Lineup. Bespoke’s Morning Lineup is the best way to start your trading day. Read it now by starting a two-week trial to Bespoke Premium. CLICK HERE to learn more and start your trial.
“It can be terribly dangerous, even perilous, to assume that because people hold positions of responsibility they are therefore acting responsibly.” – David McCullough

Below is a snippet of content from today’s Morning Lineup for Bespoke Premium members. Start a two-week trial to Bespoke Premium now to access the full report.
That rally lasted long. After bouncing from the last hour on Friday through yesterday, US stocks are set to open down by over 1% this morning following Snap’s (SNAP) earnings warning and its comments regarding the weakening broader macroeconomic environment. Adding to the concerns regarding the economy, preliminary PMI readings out of Europe also came in lower than expected. The US versions of these reports will be released later this morning. Given these growth concerns, treasuries are rallying as the 10-year yield drops back down to 2.82%. Oil prices, however, are largely unchanged on the day.
In today’s Morning Lineup, we recap on the latest declines in the tech sector (pg 4), Asian and European markets (pg 4), COVID case numbers (pg 5), the latest economic data out of Asia and Europe (pg 5), and a lot more.
After a 1.87% gain for the S&P 500 (SPY) yesterday, we’re seeing the inverse of a “Turnaround Tuesday” this morning with SPY set to open lower by just over 1%. Since 1993 when SPY began trading, there have only been five prior instances in which SPY rose 1%+ on a Monday and then gapped lower by more than 1% the next morning. As shown below, SPY continued lower from the open to the close on four of the five prior Tuesdays, and one week from the Tuesday open, SPY was down all five times for an average decline of 2.3%. One step forward, two steps back.

Start a two-week trial to Bespoke Premium to read today’s full Morning Lineup.
May 24, 2022
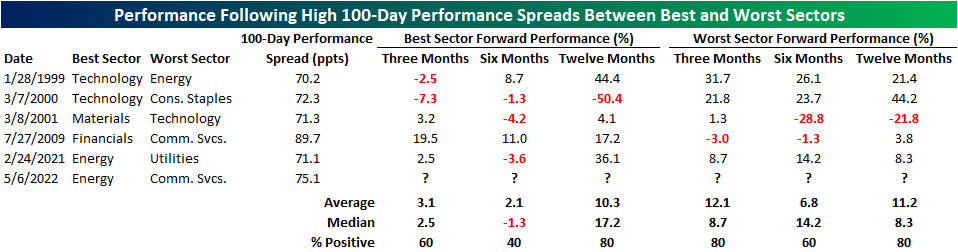
There’s no questioning that the equity market has been extremely volatile this year. So far in 2022, the S&P 500 has averaged an absolute daily move of 121 basis points (bps). Although the broader index has been incredibly weak over the last 100 trading days (down 17.1%), performance among individual sectors has diverged widely, as Energy has gained 50.7% while the Communication Services sector has declined 32.0%. The 82.7 percentage point performance spread between the two sectors is one of the highest on record. Only July of 2009 and March of 2000 saw higher readings.

Since 1990, there have only been six times in which the best-worst 100-day performance spread crossed above 70 ppts for the first time in at least 50 trading days. This tends to occur amidst a volatile market environment. In the late 90’s, investors flooded into technology stocks while dumping ‘traditional’ stocks, which led to the Technology sector outperforming Energy by 70.2 percentage points in a 100-trading day span ending on 1/28/1999. When the dot-com bubble began to burst, the inverse occurred, and Materials outperformed Technology by 71.3% in the 100 trading days ending 3/9/2001. Coming out of the Global Financial Crisis, the Financials sector roared off of a depressed base, leading to outperformance against the Communication Services sector of 89.7 ppts. In late February of 2021, the Energy sector began to bounce back after the demand shock in the industry began to abate, while the Utilities sector remained relatively weak, leading to a 100-day performance spread of 71.1 ppts. This year, the sky-rocketing price of oil has propelled energy stocks higher while the Communication Services sector has been hampered by concerns that a peak demand environment was reached in 2020 and 2021 while valuation multiples have simultaneously contracted (largely due to the Fed’s hawkish pivot) pushing the 100-trading day performance spread out to 82.7 ppts.

As investors, we must remain forward-looking. So, what typically happens after dramatic performance spreads are reached between the best and worst sectors? It’s a small sample size, but based on the previous five occurrences, investors should consider rotating out of the best performing sector (which in this case would be Energy) after the spread hits 70 percentage points and move into the worst performing sector (Communication Services).
Three months after these occurrences, the worst-performing sector over the prior 100 trading days has booked a median gain of 12.1%, which is nine ppts better than that of the best performing sector. Six months later, the median performance of the worst-performing sector in the initial 100 trading days outperformed the best performing sector by 15.5 ppts. Interestingly, twelve months later, the best performing sector in the initial 100 trading days regained the lead over the worst-performing sector outperforming on a median basis by a margin of 17.2% to 8.3%. In terms of consistency, three and six months later, the previously worst performing sector outperformed the best performing sector three out of five times, but a year later, the previously best performing sector outperformed the worst-performing sector four out of five times. Click here to become a Bespoke premium member today!
May 23, 2022
Bespoke’s Little Known Stocks (LIKS) report highlights a company that may not be on the traditional radar of most investors. In this report, we provide an in-depth analysis of the little known stock, including industry insights, growth lever analysis, insights to the competitive landscape, equity performance, relative valuation, operational efficiency, pros & cons, and more. This week’s report is about a discount retailer that has the ability to benefit as household discretionary budgets compress.

As always, this report is for informational purposes only and is not a recommendation to buy or sell any specific securities. Investors should do their own research and/or work with a professional when making investment decisions. Highlighting a stock doesn’t mean we are bullish or bearish on it. Our goal is simply to provide readers with facts to help them make informed decisions rather than just opinions.
Bespoke’s LIKS reports are available at the Bespoke Institutional level only. You can sign up for Bespoke Institutional now and receive a 14-day trial to read our LIKS reports. To sign up, choose either the monthly or annual checkout link below:
Bespoke Institutional – Monthly Payment Plan
Bespoke Institutional – Annual Payment Plan[/MM_Access_Decision]
May 19, 2022
On the backs of a disappointing Empire Fed earlier this week, the neighboring Philadelphia Federal Reserve Bank’s own reading on its region’s manufacturing economy also came in well below expectations at the headline level. The index for General Business Conditions was anticipated to decline from a healthy reading of 17 to a more modest 15. Instead, it plummeted to a barely positive reading of 2.6. That would point to a significant moderation in activity in the month of May.
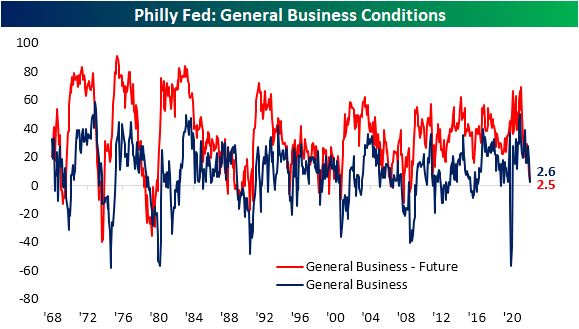
While the headline index fell sharply, the rest of the report was perhaps more mixed. Breadth was certainly weak with only three categories rising month over month (New Orders, Shipments, and Unfilled Orders). As for the indices that declined, on the one hand, some could be perceived as welcome drops with pullbacks in elevated readings of prices and delivery times. On the other hand, the moderation in Number of Employees or CapEx expectations could be taken as a less positive sign for the broader economy.

As shown in the table above, overall most current conditions indices remain historically elevated even after recent declines. Expectations indices meanwhile are generally more depressed with some readings even near record lows. As such, the average normalized distance between the current conditions and expectations categories throughout the report have broken out to the highest level since February 1988 and mid-1975 before that. Put differently, there have rarely been times in which the region’s manufacturers have reported such a dramatic difference between healthy current conditions while also holding a pessimistic outlook.

Taking a closer look at individual categories, New Orders remain well off-peak but ticked higher in May rising 4.3 points to 22.1. There was an even larger jump in expectations, although the level of that index is not nearly as elevated. The modest increase in demand was met with a huge jump in Shipments and Unfilled Orders. With a 16.2 point jump month over month, Shipments are reported to be growing at the fastest rate since the fall of 2020. Given the region’s firms are getting orders out the door at a faster clip, inventories are growing only modestly with that index falling to a barely expansionary 3.2. Additionally, that evidence of improved fulfillment also resulted in a huge drop in expectations for Unfilled Orders. In fact, that index dropped to the lowest level since March 1995. That means the region’s firms expect to work off unfilled orders at a historic rate in the coming months.

The likely reason as to why companies are anticipating such a huge improvement in fulfillment is massive expected declines in lead times. Delivery Times remain elevated but have moderated significantly in the past couple of months. Six-month expectations meanwhile have fallen all the way down to -29.1 which, like unfilled orders expectations, is the lowest level since March 1995.

Another expectations reading that has fallen precipitously in May is CapEx expectations. The reading fell to the worst reading since September 2016 indicating huge moderation in planned investment. Likewise, hiring is expected to slow as has already been observed by the current conditions index. We would note that these readings remain positive, meaning firms are still expecting to take on more hiring and spending on net, but at a more modest rate. Click here to learn more about Bespoke’s premium stock market research service.

May 19, 2022
Depending on when a respondent reported their answers to the weekly AAII sentiment survey, they could have been justified in giving either bullish or bearish. From last Thursday’s close to Tuesday, the S&P 500 rallied a little more than 4% but anyone reporting yesterday would have reflected the index giving back all of those gains in a single session. Given that back and forth of equities, sentiment remains little changed. Around a quarter of respondents remain in the bullish camp as has now been the case for three weeks in a row. Albeit a historically low reading, it is a major improvement from readings in the mid-teens only one month ago.

Bearish sentiment meanwhile ticked higher and back above 50% this week. As with bullish sentiment, that is an overwhelmingly pessimistic reading even if it is less extreme than last month when it closed in on a 60% reading.

The bull-bear spread in turn was marginally improved rising from -24.7 to -24.4 indicating sentiment stays heavily slated toward pessimism.
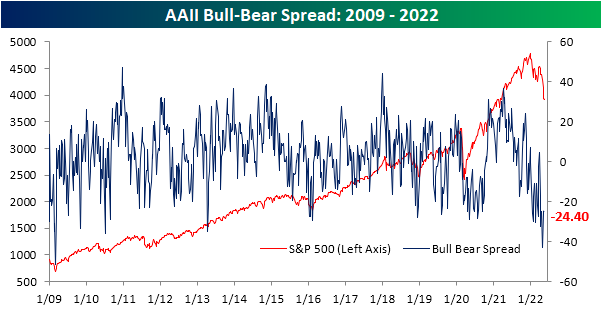
With both bearish and bullish sentiment gaining share this week, the percentage of respondents reporting neutral sentiment fell back below 25% to 23.6%. Click here to learn more about Bespoke’s premium stock market research service.
