Biggest Gainers Since 6/16 Low
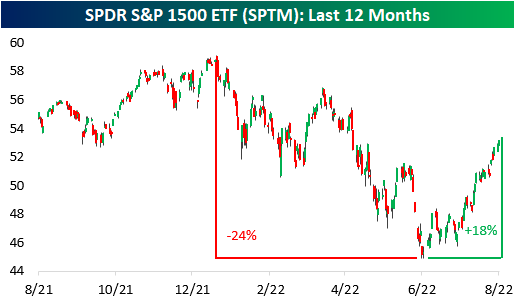
Today marks two months since the mid-June low. At the time, the S&P 1500 had declined 23.5% relative to the January 3rd high. Since then, the index has recovered substantially, gaining 17.7% off of the low. Although the S&P 1500 is still 10.0% off of its closing high, these gains have been well received by investors as the market has shown resilience in the face of rampant inflation, worsening housing data, rate hikes, supply chain constraints, and increased labor costs. This rally comes as oil prices pull back, CPI came in lower than estimated for the month of July, and earnings come in better than expected. The graph below shows the price moves in the SPDR S&P 1500 ETF (SPTM) over the last twelve months. Click here to start a two-week trial to Bespoke Premium and receive our paid content in real-time.
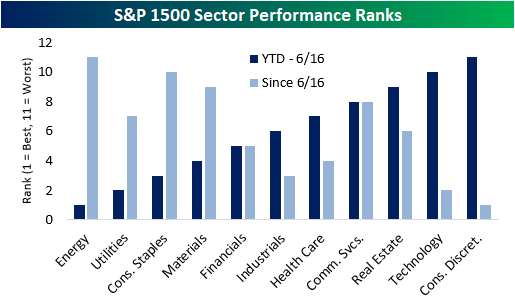
Since the June low, there has been a reversal in performance trends, as the laggards have tended to lead the way higher (on a percentage basis) while the former leaders have generally lagged. Between the start of the year and the 6/16 low, Energy and Utilities were the best performing sectors, while Technology and Consumer Discretionary were the worst. Since then, we have seen the inverse as Technology and Consumer Discretionary have been the top-performing sectors while Energy has been the worst.
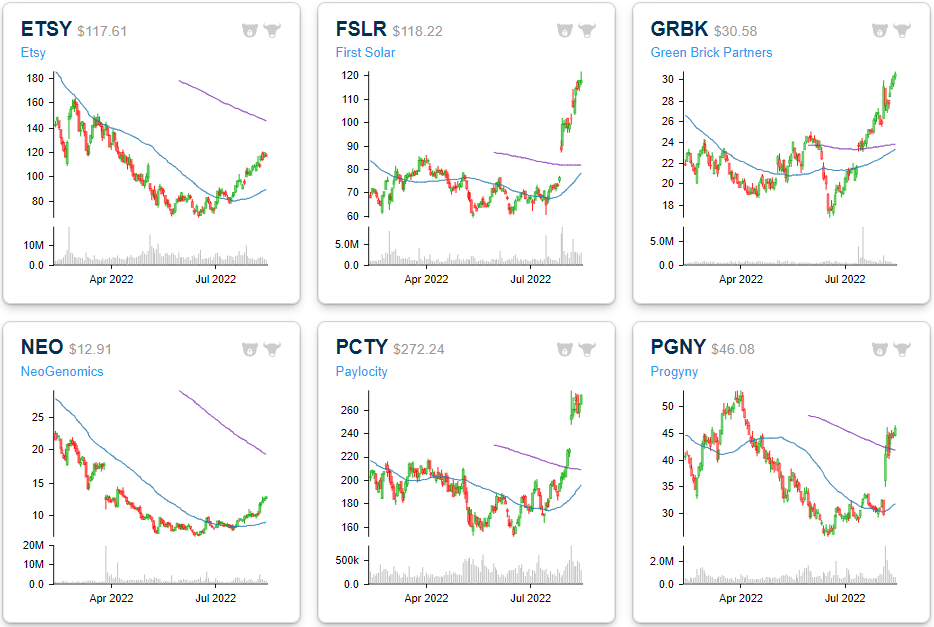
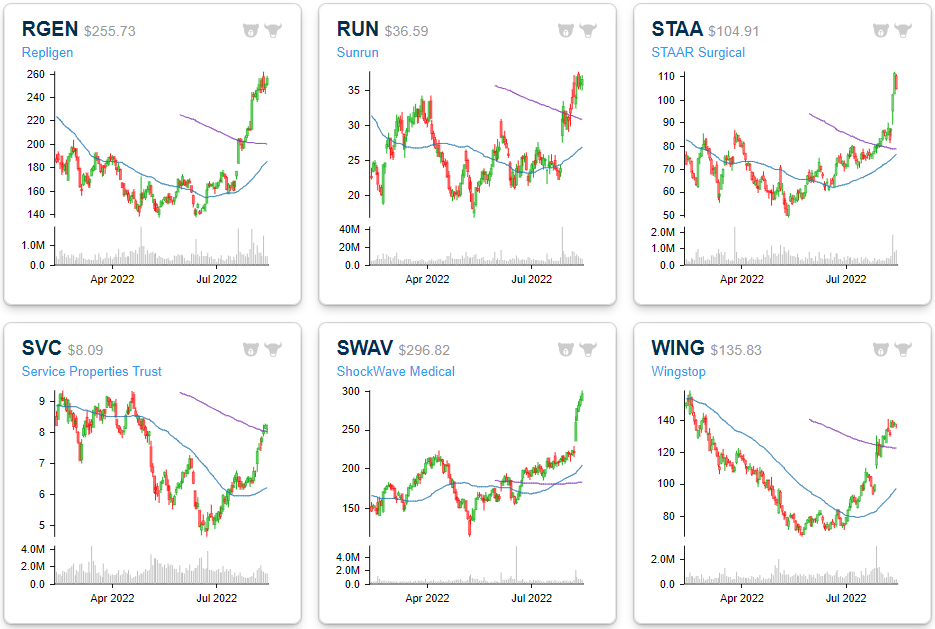
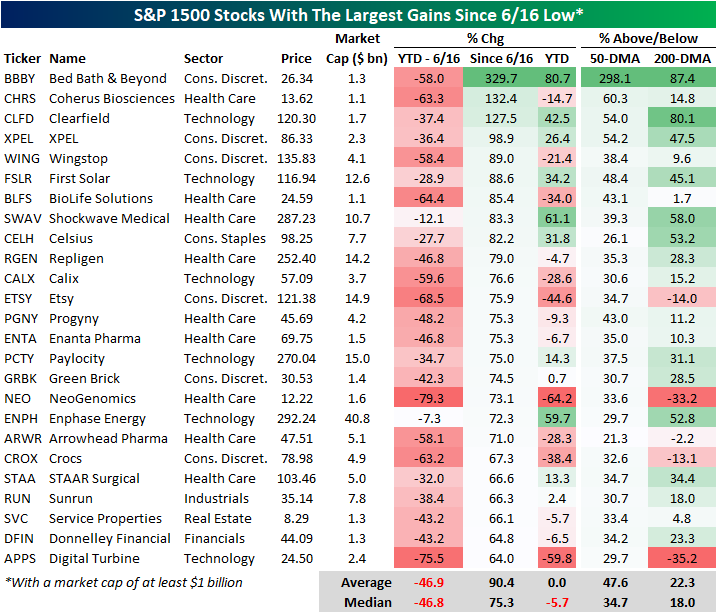
The chart below shows the 25 best-performing S&P 1500 stocks since the 6/16 low. As you can see, these stocks generally underperformed the broader index until the low, trading down by an average of 46.9%. However, since the lows, they are up an average of 90.4%, led by the newest meme stock: Bed Bath & Beyond (BBBY). Due to the drawdowns through 6/16, these stocks are still down YTD on a median basis (and even on an average basis), but they are an average of 47.6% above their 50-DMAs and 22.3% above their 200-DMAs. They’ve come a long way, and shown in the charts below, many have reached some extremely stretched levels, but even after the rallies, they still have a ways to go before coming out of the darkness. Click here to start a two-week trial to Bespoke Premium and receive our paid content in real-time.
Six-month price charts for each of these stocks are included below. You can track a custom portfolio of these names by clicking here.