Chinese Stocks Have Been Outperforming
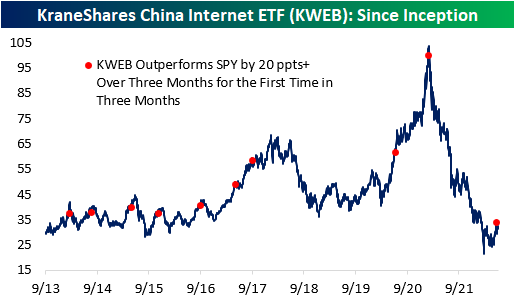
On a year to date basis, both the S&P 500 (SPY) and the KraneShares China Internet ETF (KWEB) are well in the red. However, KWEB is now outperforming SPY (-11.9% vs. -20.8%) by a considerable margin after bouncing 50% off its lows in early March. Since late May (5/24), KWEB has gained 29.7% versus a decline of 4.5% for SPY. As you can see in the first chart below, KWEB has made a few higher lows over the last few months, while SPY has continued to make lower lows.


The rolling three-month performance spread between KWEB and SPY hit an all time high of +55.8 ppts on June 10th of this year. Although the performance spread has fallen over the last few trading sessions, the outperformance is still quite notable. (It’s also worth noting that KWEB is still much further below all time highs than SPY with KWEB down 69% and SPY down 21%.)
In March of 2021, KWEB topped out and shed a considerable amount of its value. SPY didn’t follow suit until about nine months later. With KWEB rallying off of lows in recent months and actually attempting to start making higher highs, equity market bulls are hoping KWEB is leading to the upside similar to how it led to the downside.

While US markets have struggled over the last three months, Chinese equities have held up well. In this time period, the S&P 500 (SPY) has declined 16.5%, but the KraneShares China Internet ETF (KWEB) has gained 5.6%, resulting in a performance spread of 22.1 percentage points. The rolling three month performance spread peaked at 55.8 ppts on June 10th, as KWEB had gained 49.8% and SPY had dropped by 6.5% over the prior three months. This was the largest 3-month performance spread since KWEB began trading in September 2013. Throughout KWEB’s history, there have only been ten occurrences of KWEB outperforming SPY by more than 20 percentage points over three months (for the first time in three months). Although Chinese equities are still well off their highs, this recent outperformance definitely raises some eyebrows. Click here to learn more about Bespoke’s premium stock market research service.
Historically, when KWEB has outperformed SPY by 20 ppts or more over three months (for the first time in three months), the ETF has tended to deliver weak forward performance. Of the nine prior occurrences, only two resulted in positive performance over the next three months, and the average return was -7.4% (median: -7.8%). Over the next year, KWEB has tended to underperform its historical averages by 12 percentage points. Across the board, positivity rates are lower than that of all periods, which holds true for median and average performance as well. Click here to learn more about Bespoke’s premium stock market research service.