Aug 12, 2022
We like to use credit default swaps (a product that pays out investors if a reference company defaults) to track risk premiums in the corporate bond market. When risk premiums rise, credit default swaps get more expensive, and the spread implied between risk free rates and CDS rises. Click here to learn more about Bespoke’s premium stock market research service.
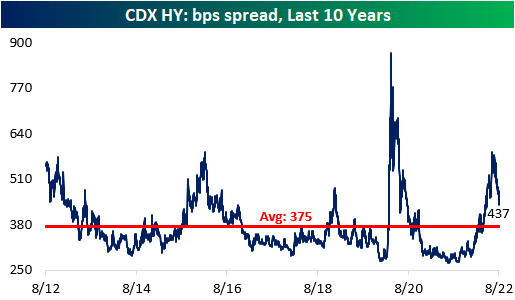
As recession fears intensified throughout the first half of 2022, both the investment grade and high yield credit default swap indices skyrocketed, gaining 106.7% and 110.5% between the start of the year and the highs, respectively. However, earnings were not as bad as feared, economic data is starting to come in better than expected, gas prices have fallen, and CPI seems to have peaked in June. All of this has caused substantial declines in CDS index spreads, with the risk premium associated with each falling by about a quarter since their summer peak.


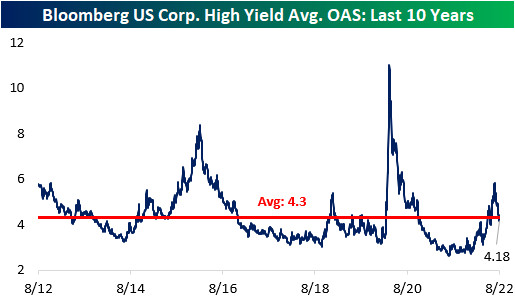
Although CDX High Yield’s spread is well off of its highs, it is still above the average over the last ten years, implying a still elevated risk related to recession and potential defaults. We can also tie CDS indices to the performance of actual corporate bonds. The option-adjusted spread (a proxy for the credit risk over risk-free rates for a given investment) for high yield bonds in the “cash” market has a 0.88 correlation to CDS over the past decade. Notably, the CDX HY spread remains above its long-term average, while that High Yield Average OAS is below its average, implying investors may be getting under-compensated for the risk they are taking in the high yield debt market. Click here to learn more about Bespoke’s premium stock market research service.
Apr 11, 2022
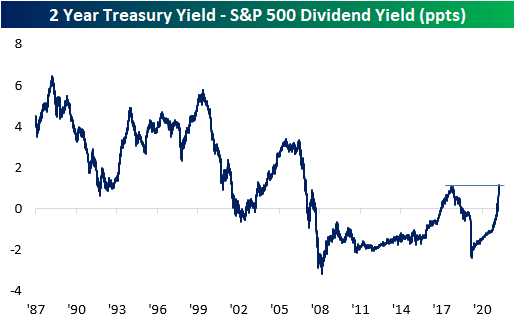
Since mid to late-2019 when interest rates really started to fall, the dividend yield on the S&P 500 consistently provided a higher yield than the two-year US Treasury. With a higher payout plus the potential for price appreciation, equities looked more attractive to many investors. The period from the Financial Crisis through 2017 also saw a similar setup where the S&P 500’s dividend yield was higher than the yield on the 2-year, but before the Financial Crisis and the FOMC’s zero-interest-rate policy, it was extremely uncommon for the S&P 500 to yield more than the two-year Treasury. This year has caused a tidal shift in the balance of power in yield between the S&P 500 and the two-year Treasury. As the Fed came to the conclusion that inflation wasn’t as transitory as originally thought and found itself behind the inflation curve, it shifted from a much more accommodative stance to one that was more biased towards tightening, and that shift resulted in one of the most rapid increases in two-year Treasury yields in decades. In the process of this spike in rates, back in February, the yield on the two-year rose back above the dividend yield of the S&P 500 for the first time since 2019.

As Treasury yields have continued to spike, the premium in yield of two-year Treasuries relative to the dividend yield of the S&P 500 reached an important milestone last Friday (4/8). As shown in the chart below, the spread between their yields widened out to 110 basis points (bps), taking out the high of 108 bps from 2018. At these levels, the spread between the two is now the widest it has been in fourteen years since the Financial Crisis. It started with long-term Treasury yields, but as the overall trend in rates has been higher, most of the Treasury yield curve is now yielding more than the S&P 500. For years now, investors have had a TINA (There Is No Alternative) relationship with the stock market, but as interest rates have shot higher, TINA is taking a backseat to BABY (Bonds Are Better Yielders). Click here to try out Bespoke’s premium research service.