Massive Sector Performance Spreads
There’s no questioning that the equity market has been extremely volatile this year. So far in 2022, the S&P 500 has averaged an absolute daily move of 121 basis points (bps). Although the broader index has been incredibly weak over the last 100 trading days (down 17.1%), performance among individual sectors has diverged widely, as Energy has gained 50.7% while the Communication Services sector has declined 32.0%. The 82.7 percentage point performance spread between the two sectors is one of the highest on record. Only July of 2009 and March of 2000 saw higher readings.

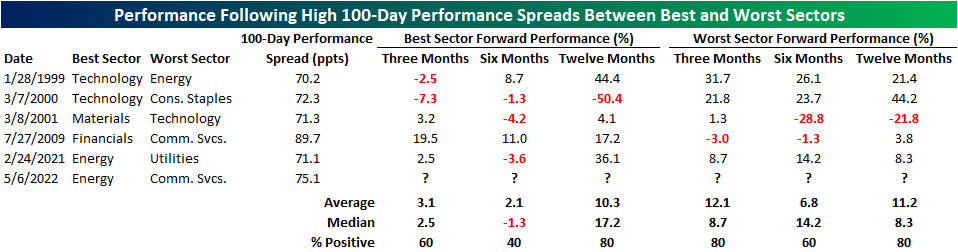
Since 1990, there have only been six times in which the best-worst 100-day performance spread crossed above 70 ppts for the first time in at least 50 trading days. This tends to occur amidst a volatile market environment. In the late 90’s, investors flooded into technology stocks while dumping ‘traditional’ stocks, which led to the Technology sector outperforming Energy by 70.2 percentage points in a 100-trading day span ending on 1/28/1999. When the dot-com bubble began to burst, the inverse occurred, and Materials outperformed Technology by 71.3% in the 100 trading days ending 3/9/2001. Coming out of the Global Financial Crisis, the Financials sector roared off of a depressed base, leading to outperformance against the Communication Services sector of 89.7 ppts. In late February of 2021, the Energy sector began to bounce back after the demand shock in the industry began to abate, while the Utilities sector remained relatively weak, leading to a 100-day performance spread of 71.1 ppts. This year, the sky-rocketing price of oil has propelled energy stocks higher while the Communication Services sector has been hampered by concerns that a peak demand environment was reached in 2020 and 2021 while valuation multiples have simultaneously contracted (largely due to the Fed’s hawkish pivot) pushing the 100-trading day performance spread out to 82.7 ppts.

As investors, we must remain forward-looking. So, what typically happens after dramatic performance spreads are reached between the best and worst sectors? It’s a small sample size, but based on the previous five occurrences, investors should consider rotating out of the best performing sector (which in this case would be Energy) after the spread hits 70 percentage points and move into the worst performing sector (Communication Services).
Three months after these occurrences, the worst-performing sector over the prior 100 trading days has booked a median gain of 12.1%, which is nine ppts better than that of the best performing sector. Six months later, the median performance of the worst-performing sector in the initial 100 trading days outperformed the best performing sector by 15.5 ppts. Interestingly, twelve months later, the best performing sector in the initial 100 trading days regained the lead over the worst-performing sector outperforming on a median basis by a margin of 17.2% to 8.3%. In terms of consistency, three and six months later, the previously worst performing sector outperformed the best performing sector three out of five times, but a year later, the previously best performing sector outperformed the worst-performing sector four out of five times. Click here to become a Bespoke premium member today!