Jul 20, 2022
Since June 16th, the market has reversed course higher, making the date at least a near-term bottom. From a technical perspective, the Russell 1000 broke through its 50-day moving average yesterday and broke above its upper downtrend line today. The 50-DMA is still moving lower, but this is the first time that the Russell 1000 has been above the 50-DMA since April 20th. However, the index is still 9.7% below its 200-DMA. These moves come as commodity prices have pulled back and earnings season begins.

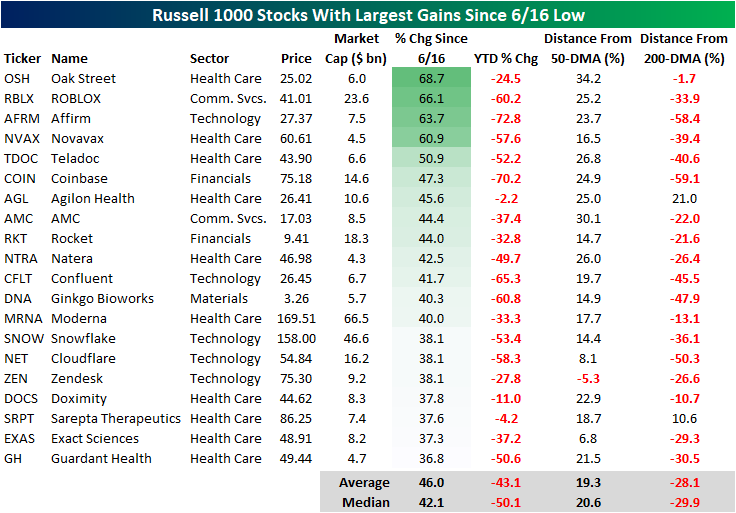
As we highlighted in a Chart of the Day earlier this week, the lagging sectors during bear market declines tend to be the leaders in bear market rallies, which is holding true in the bounce since 6/16. The table below shows the 20 best performing stocks in the Russell 1000 Index since the 6/16 low. As you can see, these stocks are all still down considerably on a YTD basis, declining a median of 50.1%. However, these stocks have rebounded by a median of 42.1% since the low on 6/16. Only one of these stocks is below its 50-DMA, and only two are above their respective 200-DMA. If you think that the bear market has concluded, these would be some of the names worth looking deeper into.
On the other hand, the best performing sectors during bear market declines tend to be the worst performing sectors during bear market rallies. Of the 20 worst performing Russell 1000 stocks since 6/16, 14 belong to the energy sector (which has been the best sector on a YTD basis by a wide margin). On a median basis, these 20 stocks are still up 13.6% on a YTD basis, but they’ve shed 13.7% of their value since the market bottomed in mid June. Notably, these stocks (on a median basis) are closer to their 200-DMAs than they are to their 50-DMAs. If you think that we are currently in a bear market rally that is bound to reverse course, these names would be worth looking deeper into.

Jun 27, 2022
The US stock market has been weak and in a downtrend since late 2021, and there are some individual names that haven’t been able to post a positive month in quite some time. Of all S&P 1500 members, there are actually eight stocks with a market cap of at least $2 billion that are on a monthly losing streak of seven or more months. Six of these eight names are members of the Consumer Discretionary sector (the worst performing sector on a YTD basis), which is down 27.8% in 2022 (as of Friday’s close). The largest company on this list is Nike (NKE), which reports after the close today. The stock would need to gain about 7.5% through the end of the month to break its seven month losing streak. The average stock on this list would need to gain 6.7% through the close on 6/31 to break their respective streaks. Etsy (ETSY) is the closest to breaking its streak, needing to gain just 0.9%, while Under Armour (UAA) is the furthest, needing 13.7%. On a YTD basis, these stocks are down an average of 41.4% (median: -35.0%), meaning they would need to gain ~70% through year’s end to finish 2022 in the green.

Below is a quick look at one-year price charts for these eight stocks. (You can click here to create a custom portfolio of these names if you’re a Bespoke client.) Unsurprisingly, these stocks on 7+ month losing streaks are trading in pretty steep long-term downtrends, and they’ve got a lot of work to do to get back to where they were trading late last year. New uptrends can’t emerge until these long monthly losing streaks finally come to an end. Click here to learn more about Bespoke’s premium stock market research service.

May 13, 2022
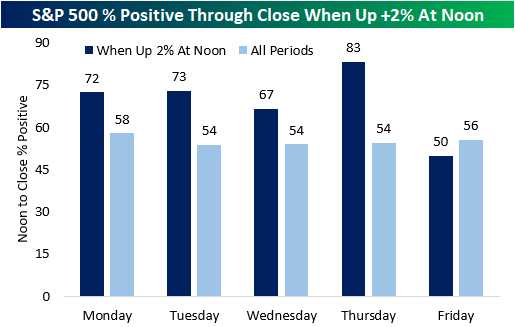
After a tumultuous week, the S&P 500 gapped higher this morning and continued to rip throughout the morning. As of noon, the S&P 500 was up 2.2%, a much-needed rally after a week of pain. Since the start of 1983, the S&P 500 has been up by 2%+ at noon 110 different times, 22 of which have occurred in the pandemic era. There has been only one occurrence this year (3/9) and two in 2021 (3/1/21 and 12/7/21). On a median basis, the S&P 500 averages a noon-to-close gain of 54 basis points (bps) when it rallies 2%+ in the morning, which is over ten times the median of all periods (5 bps). However, looking at just Friday occurrences, the S&P 500 has had a median drawdown of 9 bps from noon to the close, which is 11 bps weaker than that of all periods. Additionally, Friday was the only weekday with median noon-to-close returns below that of all periods when the index had gained at least 2% by noon.

Friday is also the only day of the week with lower than average positivity rates following 2%+ morning rallies. Thursday is the strongest with a positivity rate of 83%. Overall, the index has performed positively from noon to close 70% of the time following these occurrences. click here to become a Bespoke premium member today!