Aug 15, 2022
As mortgage rates remain elevated relative to 2021 levels but housing supply remains thin, NAHB’s Housing Market Index fell again this month, reaching the lowest level since May of 2020. Last month, the index posted its second largest month over month decline, and following this report, the index has fallen by 18 points over the last two months, the third largest two month decline on record, falling just short of April and May of 2020. Click here to start a two-week trial to Bespoke Premium and receive our paid content in real-time.

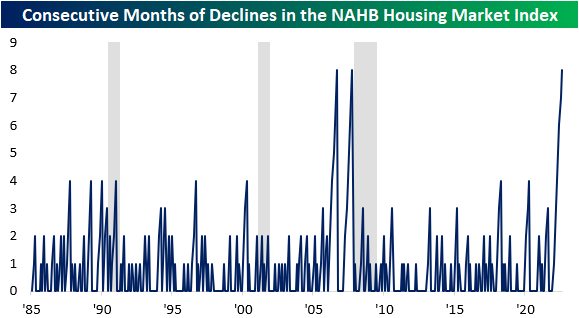
The NAHB Housing Market Index has now declined for eight consecutive months, which is tied for the longest monthly losing streak since the index’s inception in 1985. The only two other periods with an equal number of monthly declines were the eight months ending in October 2007 and before that September 2006. As most Americans remember, these periods were followed by precipitous declines in home values. Interestingly, the NY Post reported that Google searches for “sell my home fast” spiked by 2,750%.
All of the sub-indices within the report fell as well, indicating broad weakness. Apart from Future Sales and sentiment in the Western region, all of the other sub-indices experienced declines that were in the bottom 5th percentile of all periods. However, the current readings are not nearly as negative. Future sales and traffic are in the 18th and 23rd percentile, but the Northeast is still in the 63rd percentile. Although the current readings aren’t as low as the readings leading up to previous recessions, it is difficult to be positive given the current trends.

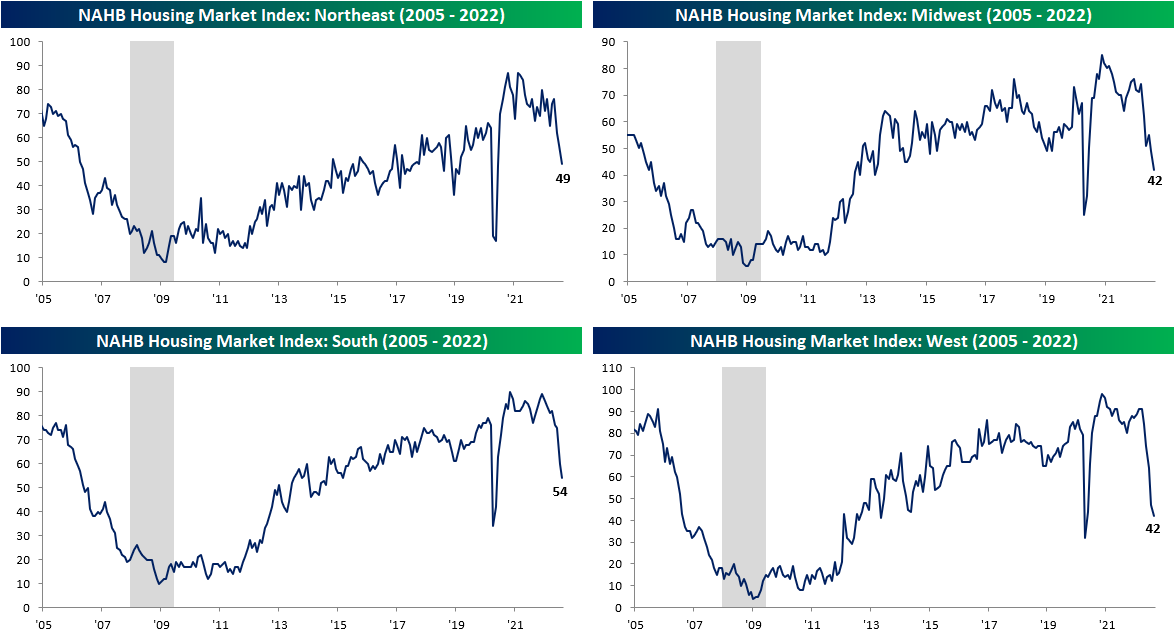
As shown above, no geographic region has been safe from the plunge in sentiment, but the Northeast has held up better than the others. Over the last eight months, the West, South, and Midwest regions have seen their largest eight-month declines in the index on record, while the decline in the Northeast is the third worst on record. Click here to start a two-week trial to Bespoke Premium and receive our paid content in real-time.
The stocks most affected by these trends – homebuilders – struggled during the sustained sell-off between the end of 2021 and mid-June, but have recovered by over 28% relative to the lows. However, the ETF is still down over 22% relative to the highs. The recovery might be due to the fact that much of the negativity has been priced in, historically low valuation multiples, and a pullback in interest rates. The chart below shows the performance of the SPDR S&P Homebuilders ETF (XBH). As you can see, XBH has broken its downtrend and has been moving consistently higher carving out what might be a new uptrend.

Jul 12, 2022
As of today, the percentage of inverted points on the yield curve reached the YTD highs seen in mid-June of 17.9%. This comes as the 10-year and 1-year invert, as well as the 5-year and 2-year. The inversion of points on the yield curve (particularly 2s&10s) tends to be cited as a leading recession indicator, due to the fact that higher near-term yields imply a higher risk in the near-term rather than the long-term, the inverse of what is typically true. The graph below shows the rolling percentage of inverted points on the curve over the last six months. Click here to learn more about Bespoke’s premium stock market research service.

As mentioned above, the spread between the 10-year and 1-year treasury inverted today, which is the first occurrence since October of 2019. Following prior inversions of this part of the yield curve since 1970, a recession has followed in the next two years 99.8% of the time which would suggest that a recession at some point in the next two years is almost certain. Following the first inversion in at least one year when a recession did follow, it has taken an average of 271 trading days to officially enter a recession. The shortest time it took to enter into a recession following 1s and 10s inversion was in 1973, when it took just 191 trading days. As mentioned, going back to 1970, recessions have followed within two years of an inversion 99.8% of the time. The only time that this part of the curve inverted and a recession did not follow within two years was after a brief stint in the fall of 1998.

Jun 16, 2022
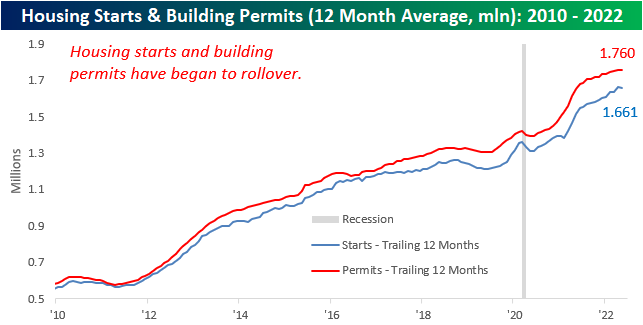
Earlier this week, we highlighted the fact that mortgage activity had fallen off a cliff due to a historic rise in rates. This is an important factor to keep in mind as the housing market tends to be a strong leading indicator for recessions, as every recession besides the COVID crash since the early 1960s has been preceded by a pronounced decline in Housing Starts. Although the NAHB index has already rolled over substantially, Housing Starts and Building Permits are yet to drop on a trailing twelve-month basis. However, the data has been showing signs of weakness, as we have now seen two consecutive months of declines in permits and a significant month-over-month fall in starts.
The table below breaks down this month’s report by type of unit and region and shows both the month-over-month and year-over-year changes. Contrary to what we saw last month, Housing Starts moved higher in the Northeast and Midwest on a m/m basis, while the South and West saw dramatic declines. On a y/y basis, only the Northeast (smallest of the four regions) saw starts move higher. In aggregate, Housing Starts fell by 14.4% month over month and 3.5% year over year. Although multi-units fell more than single units, the decline was substantial for both. In terms of permits, there was no positivity in sight, as every region saw m/m declines. This is not a positive sign for future starts data, as permits must be issued before starts can occur. In aggregate, Building Permits fell by 7.0% month over month, driven by a massive decline in the Northeast.

For the first time since February of 2021, the 12-month average of Housing Starts declined on a m/m basis. A rollover in this figure tends to be a strong recession indicator, which based on prior history would suggest that the economy is not yet in a recession. If this data continues to weaken, though. recession alarms will start ringing.

The charts below show the rolling 12-month average for Housing Starts and Building Permits since 2010 on both an overall basis (top chart) and for single-family units specifically (bottom chart). Overall, the 12-month average for headline starts and permits has experienced headwinds as of late with the rate of increase for both slowing down and starts actually showing a slight decline. The trend for single-family units, however, is much more divergent as permits have already started to roll over after peaking last summer while single-family starts have essentially leveled off during that same span. . Click here to become a Bespoke premium member today!

Jun 13, 2022
There’s been no hiding from pain in equity markets since last Tuesday (June 7th). As mentioned in our Morning Lineup today, the S&P 500 is on pace to decline by 1%+ on four consecutive days, and if we hold onto these levels through the close, the index will have dropped over 2% for three consecutive days. This period of weakness comes on the back of another hotter than expected CPI print, continued disruption from the war in Ukraine, and a 10-year yield healthily above 3%. As of midday, the Russell 3000 was down 9.5% since the close on 6/7 and 22% YTD.
As is the case for every pullback, long-term investors should look for beaten-down names with solid growth runways. The first step of this process is to recognize which names have pulled back the most and then begin looking for diamonds in the rough. The table below shows the 18 Russell 3000 members who are down more than 25% since 6/7 with a market cap of at least $1 billion. For the entire Russell 3000, the average stock in the index is down 24.4% YTD (median: -24.3%) and 10.44% since 6/7 (median: -9.86%). Narrowing that field down to stocks with market caps of at least $1 billion, the average stock is down 17.4% on a YTD basis (median: -20.5%) and has traded down by 10.3% since 6/7 (median: -9.8%).
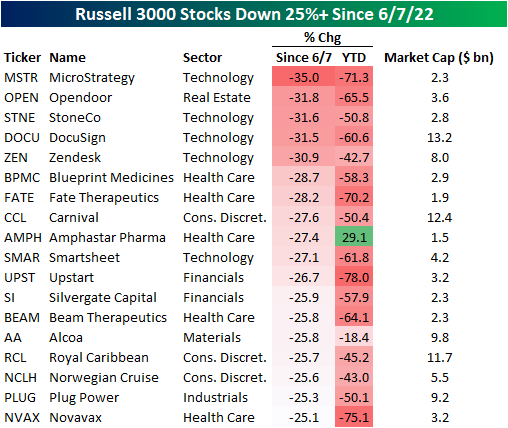
The exposures of these 18 stocks are quite mixed, as the list includes both pandemic darlings (i.e. Opendoor- OPEN, DocuSign- DOCU) and some of the biggest pandemic era decliners (i.e. Carnival- CCL) and Royal Caribbean-RCL). On a median basis, these stocks trade 4.5 times sales and are expected to see revenue increase by 38.6% over the next twelve months. Of these 18 names, Beam Therapeutics (BEAM) is expected to see the largest sales decline (-38.7%) and Norwegian Cruise (NCLH) is expected to see the largest increase (449.8%). Relative to sales, BEAM is the most expensive at 37.4 times LTM sales and OPEN is the cheapest at 0.3X.
Individual stock performance since 6/7 does appears little correlated to YTD performance. As shown, only 8.1% of the variation in the percent change since 6/7 can be explained by YTD performance. Click here to become a Bespoke premium member today!
