Apr 13, 2022
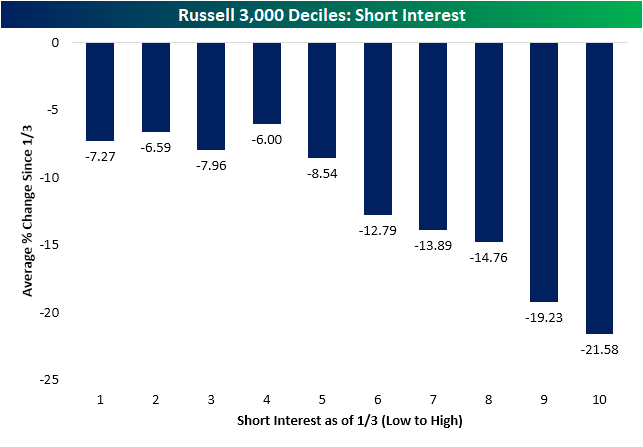
The first quarter of last year was marked by a period of massive short squeezes leading to outperformance of stocks with high levels of short interest. A little over one year later, the opposite has held true. As shown below, the stocks with the highest levels of short interest at the time of the last all time high on January 3rd have been the worst performers over the past few months. The decile of Russell 3,000 stocks with the highest levels of short interest at the start of the year have fallen 21.5% since January 3td while the first four deciles of stocks with the lowest levels of short interest have only fallen mid-single digits.
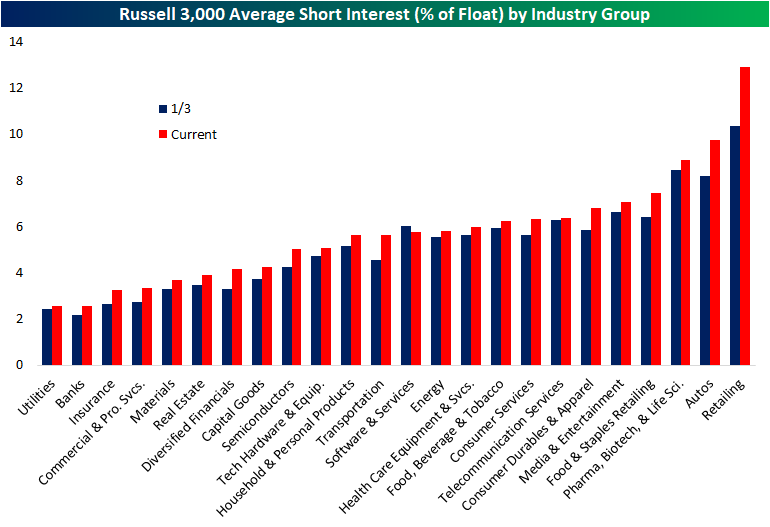
The latest update of short interest data through the end of March hit the tape earlier this week. The average level of short interest as a percent of float for all Russell 3,000 stocks fell sequentially from the mid-March update but with an average short interest reading of 5.78%, current readings are roughly half of one percentage point higher than at the start of the year.
Breaking it down by industry group, retail has seen the biggest increase in average short interest and now has the highest level of any industry group. Autos are the runner-up in both departments as short interest has climbed from 8.2% on January 3rd to 9.75% today. Utilities, Banks, Insurance, Commercial and Professional Services, Materials, and Real Estate, meanwhile, are on the other end of the spectrum as the only sectors with short interest as a percentage of float below 4%.
Turning to individual stocks, Rent the Runway (RENT) now has the most elevated level of short interest as the only stock in the index with over half of its free-floating shares sold short. Conn’s (CONN), however, comes close with 49.16% of its float sold short. Both stocks have seen sharp increases in bearish bets this year as those readings compare to 26.82% and 14.58%, respectively for RENT and CONN. Most of these heavily shorted names have been pain trades this year, but there are a small handful of exceptions. Gogo (GOGO) and Arch Resources (ARCH) have seen substantial rallies of 66.3% and 72.45%, respectively, as the broader market has pulled back. While not as strong of a performance, Dillard’s (DDS) has also rallied solidly gaining 16%.

As previously mentioned, CONN finds itself near the top of the list of the most heavily shorted Russell 3,000 stocks, but it has been the one with the largest increase in short interest of the whole index since the January 3rd high. No other name has seen short interest rise by more than 30 percentage points in that time, but MedAvail (MDVL), Rent the Runway (RENT), and Frontier (ULCC) have seen readings rise over 20 percentage points. Click here to view Bespoke’s premium membership options.

Apr 1, 2022
Please click the image below to view our April 2022 market calendar. This calendar includes the S&P 500’s average percentage change and average intraday chart pattern for each trading day during the upcoming month. It also includes market holidays and options expiration dates plus the dates of key economic indicator releases. Click here to view Bespoke’s premium membership options.

Mar 25, 2022
Earlier this week, we looked at US sector and individual stock performance since the COVID-low to give our readers a perspective on the huge moves seen since March 23, 2020. Today, we are looking into the performance of each major country ETF since the COVID-low to show you the differentiation across the globe for US investors. COVID impacted each country differently for a variety of factors. First, government responses differed greatly. Countries like China, Australia and Canada have been excessively restrictive, while most European countries were less stringent (with a few notable exceptions). Click here to view a “stringency” index generated by Our World in Data.
The second economically-impacting factor that has led to divergent equity performance has been buying power. With supply chain and inflation headwinds, poorer nations simply cannot compete for goods, as the order value ticked higher due to strong global demand and a constrained supply chain. These nations were essentially out-bid for everything they needed, be it food, gas, or durable goods.
A third factor is the mix of goods and services exported by each nation. Countries that are primarily commodity exporters (like Brazil and Australia) struggled initially, but have benefitted substantially as their average selling prices have soared. On the other hand, countries reliant on commodity imports have suffered, as the sky-rocketing of input costs dampens production and economic activity.
We could go on and on about all of the factors that impacted economic growth on a country-by-country basis. Needless to say, the performance in equity markets across the globe has varied greatly. Of the major country ETFs that we tracked, Canada has been the strongest performer since the COVID-low, largely due to their economic mix of commodity and services exports with very little manufacturing exposure (relative to comparable nations). Canada is close to self-sufficient in terms of inputs, as it is a commodity-rich nation. This holds true for Australia as well. Only Canada (EWC), Mexico (EWW), India (PIN) and Australia (EWA) have outperformed the US (SPY) since 3/23/20. Mexico benefitted from a shifting in the manufacturing environment, as port congestions and general supply chain woes pushed the US to ramp up Mexican imports. As labor became more and more expensive, an increasing number of corporations outsourced SG&A functions to India, which helped spur economic activity.
The worst performers have been Hong Kong (EWH), China (ASHR), Spain (EWP) and Japan (EWJ). China and Hong Kong have been negatively impacted by political fears, as China pushes for US-delisting and Hong Kong has seen its independency slowly fade. The table below summarizes the performance since the COVID-bottom (3/23/20) and on a YTD basis. As you can see, the top performer YTD by a substantial margin is Brazil, as their economy is highly concentrated into energy-related commodities.
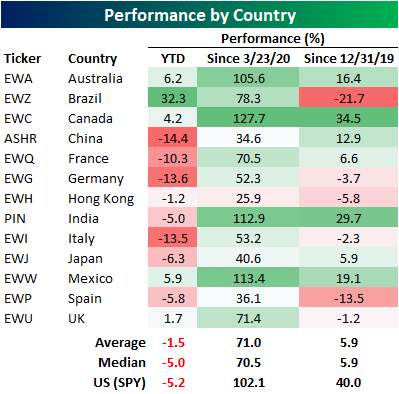
Below is a set of graphs that shows the performance of each country listed above since the end of 2019 just before COVID hit. While the US (SPY) is well above where it ended in 2019, many country ETFs are actually down since then. These include Brazil (EWZ), Germany (EWG), Hong Kong (EWH), Italy (EWI), Spain (EWP), and the UK (EWU).
If you have an interest in learning more about Emerging Markets, we recently released the Bespoke Emerging Market 50, which tracks 50 ADRs domiciled in emerging economies that have either experienced strong earnings growth over the last several years, are positioned to recover substantially, or have unique upside due to the geopolitical environment. Click here to try out Bespoke’s premium research service, which will grant you access to the Bespoke Emerging Market 50.
