Democrats Expected to Keep Senate Control
President Joe Biden currently has the worst pre-mid-term approval rating since President Truman in 1950. A multitude of factors, including inflation, the botched withdrawal from Afghanistan, weakening economic data, age, and a lack of definitive action on campaign promises have all contributed to the President’s unpopularity. Although Americans are generally dissatisfied with the President, betting markets still project a nearly two-thirds chance that Democrats retain control of the Senate (chart below from electionbettingodds.com). The only two previous Presidents that saw approval ratings lower than Biden’s heading into mid-terms (since the start of WWII), Roosevelt in 1942 (third term) and Truman (first term) in 1946, ended up in the mid-terms losing twelve and five senate seats, respectively. In fact, only five Presidents have seen their party’s position in the Senate improve or remain flat since the start of WWII in a mid-term election cycle. In these five cycles, the sitting President averaged an approval rating of 57.2%, which is 19.2 percentage points higher than that of Biden.

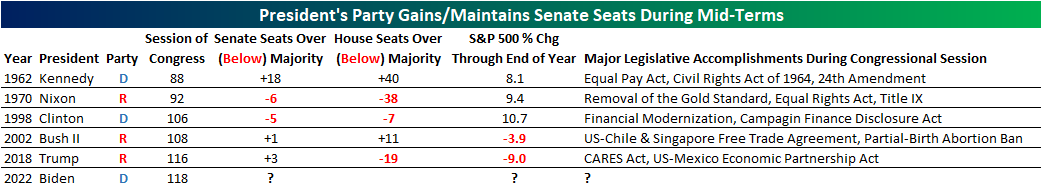
Although only 20% of Presidential terms since the start of WWII have seen their party gain Senate seats during mid-terms, subsequent sessions of congress following these election cycles passed some significant legislation. The 88th Congress (under the Kennedy/Johnson administration) passed the Civil Rights Act of 1964, which prohibited discrimination on the basis of race, sex, religion, ethnicity, or national origin. In addition, that session of congress banned the discrimination of pay in regards to sex, and the 24th amendment was passed (which banned states from making the right to vote in federal elections conditional). The 92nd Congress (under Nixon) removed the dollar from the gold standard and established Title IX. The 116th Congress under Trump passed the CARES act, which helped the country recover from the pandemic and funded vaccination initiatives.
Regarding equity market returns, in the five mid-terms where the sitting President’s party gained Senate seats in a mid-term election year, the S&P 500 has averaged a gain of 3.1% between the election date and year-end, posting gains three out of five times. Click here to start a two-week trial to Bespoke Premium and receive our paid content in real-time.
The table below summarizes every mid-term election year since the US entered WWII, For each cycle, we show the number of seats gained or lost by the President’s party, the S&P 500’s YTD performance as well as the YTD change in the 10-year US Treasury yield. In terms of economic data, we also included a look at the y/y change in CPI and the Unemployment Rate (through September), and then finally Gallup’s Presidential Approval Rating. Although one might assume that a strong stock market boosts the President’s party in the Senate for the mid-terms, the equity market was down on a YTD basis heading into mid-terms in three of the five years highlighted above. However, the average y/y change in CPI was just 2.7% and only above 5% once. For the sake of comparison, y/y headline CPI as of the end of July currently stands at 8.5%. In terms of approval ratings, every other President who saw a gain in Senate seats in a mid-term election year had the approval of a majority of Americans, whereas nearly two-thirds of Americans currently disapprove of the President. In those mid-term years when the President had an approval rating below 50%, the average loss of Senate seats for the President’s party was five, and the only one to pick up Senate seats was Trump (+2) in 2018. Given this backdrop, the possibility of Democrats keeping their effective majority in the Senate would seem unlikely, but with less than three months until Election Day, the betting markets say otherwise. Click here to start a two-week trial to Bespoke Premium and receive our paid content in real-time.
