Apr 28, 2022
Yesterday, Meta Platforms (FB) reported earnings. In the report, the company noted a sequential rise in both daily and monthly active users in every region apart from Europe, which can be attributed to the effects of the war in Ukraine. This gave investors a sigh of relief, sending shares up over 14% in premarket trading.
FB has gapped higher by 5%+ in reaction to earnings fourteen times since its IPO. Historically, when this occurs, the stock’s performance from the open and close has been modestly positive, booking gains 57% of the time. The average performance was a gain of 64 basis points (median: 80 bps). The worst intraday performance came in 2014 when the stock traded down by 2.0% percentage points intraday after gapping up 16.05%. On the other hand, the best intraday performance in these time periods occurred in 2018, when the stock gained 4.5% after gapping up 6.0% at the open.
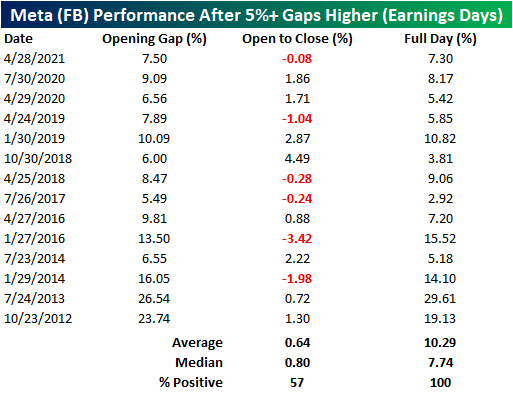
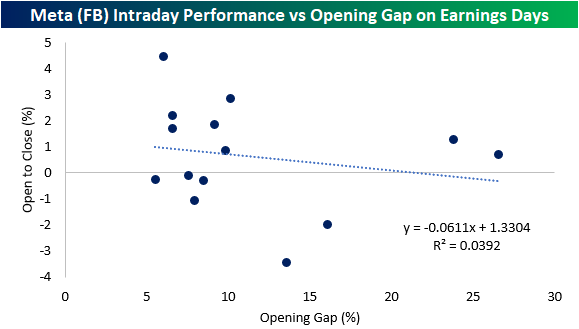
Today marks the fourth-best opening gap since FB went public. This is particularly interesting, as the y/y revenue growth rate in this quarter was the slowest seen since the company went public in 2012. Notably, the opening gap does not seem to be a determining factor for the opening to close performance. As you can see from the chart below, only 3.9% of the variation in the open to close performance can be explained by the size of the opening gap (for 5%+ opening gap gains on earnings). Click here to view Bespoke’s premium membership options.
Apr 26, 2022
The Richmond Fed’s manufacturing survey was released this morning showing a modest improvement in conditions in the month of April. The headline number rose by a point to 14 which is still in the middle of the pandemic range of readings and the highest level since December.

In spite of the improvement in the composite index—a weighted average of shipments, new orders, and employment—the breadth of this month’s report was negative with over half of the categories declining month over month. Two of those declining categories were new orders and employment which are again inputs for the composite. That means the higher reading of the composite was entirely thanks to the 8-point increase in shipments.
Looking across other areas of the report, expenditures were weaker while inventories are recovering from historic lows. While business conditions are mixed to deteriorating, supply chains are showing signs of improvement as evidenced by the increase in shipments.
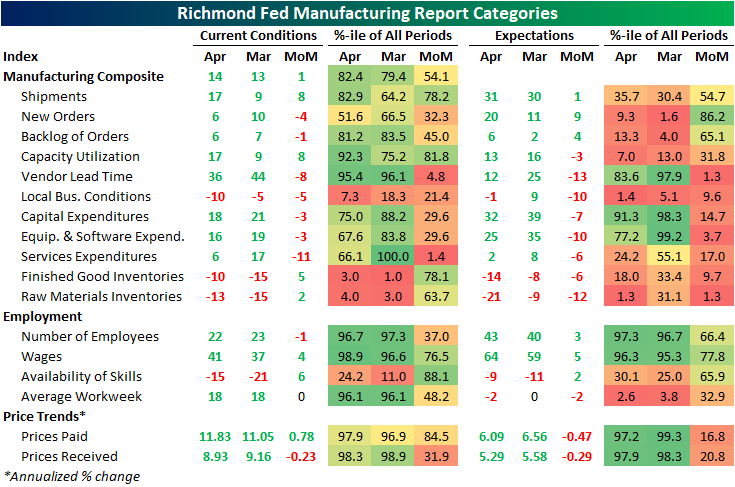
While shipments were an area of strength, another input to the composite, new orders, fell 4 points and is back near the middle of its historical range. Expectations, however, experienced a sizeable rebound with that index rising 9 points. While that increase bucks the trend of weak expectations readings relative to current conditions that we have seen in other regional Fed surveys (which we discussed in last night’s Closer), this index’s increase was the exception rather than the rule. As shown in the table above, only a handful of other expectations categories rose month over month with many declines ranking in the bottom decile of monthly moves.
The big increase to shipments left that index at the highest level since last July as backlog of orders are growing at a substantially more modest pace compared to earlier in the pandemic. One likely reason that both of these readings are improving is a coincident improvement in supply chain stress. The index for lead times saw an 8-point decline ranking in the bottom 5% of all monthly moves. That leaves the index one point above the December low of 35.

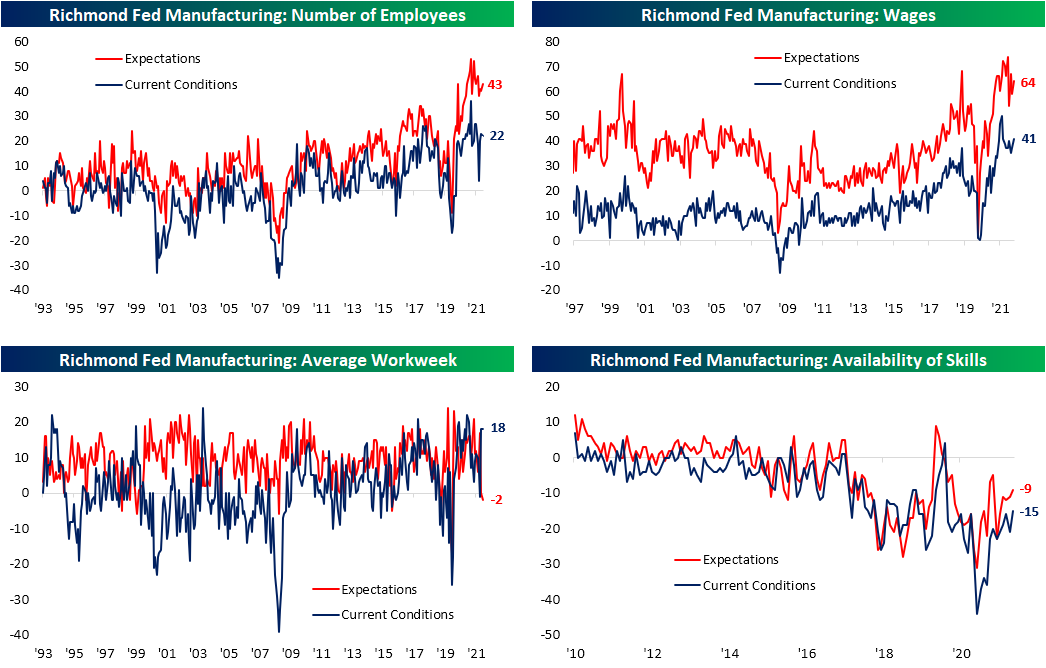
Employment metrics were mixed this month. The region’s firms are still hiring on a net basis, but hiring has peaked and declined again in April. That was in spite of firms also reporting better availability of workers with in-demand skills as that index rose to the highest level since July 2020. With that being said, the negative number indicates a still insufficient supply of quality talent. Wages, meanwhile, saw one of the larger increases in recent months rising to the highest level since September. The average workweek was unchanged at a healthy level in the top 5% of its historical range, but expectations are calling for declines in hours worked on the horizon. Click here to learn more about Bespoke’s premium stock market research service.
Apr 13, 2022
Searching for ways to better understand the fixed income space or looking for actionable ideas in this asset class? Bespoke’s Fixed Income Weekly provides an update on rates and credit every Wednesday. We start off with a fresh piece of analysis driven by what’s in the headlines or driving the market in a given week. We then provide charts of how US Treasury futures and rates are trading, before moving on to a summary of recent fixed income ETF performance, short-term interest rates including money market funds, and a trade idea. We summarize changes and recent developments for a variety of yield curves (UST, bund, Eurodollar, US breakeven inflation and Bespoke’s Global Yield Curve) before finishing with a review of recent UST yield curve changes, spread changes for major credit products and international bonds, and 1 year return profiles for a cross section of the fixed income world.
In this week’s report we highlight a fixed income investment that has performed beautifully amid extremely high inflation.

Our Fixed Income Weekly helps investors stay on top of fixed income markets and gain new perspective on the developments in interest rates. You can sign up for a Bespoke research trial below to see this week’s report and everything else Bespoke publishes free for the next two weeks!
Click here and start a 14-day free trial to Bespoke Institutional to see our newest Fixed Income Weekly now!
Apr 12, 2022
Log-in here if you’re a member with access to the Closer.
Looking for deeper insight into markets? In tonight’s Closer sent to Bespoke Institutional clients, we begin tonight with a look at market pricing for policy rates before diving into today’s update of CPI data and some reasons to believe inflation has peaked. We then update the latest data on government receipts and outlays. We round out tonight’s note with a recap of the historically bad reopening of 10 year notes.
If you’re wondering what the Closer is like each day, click here or on the thumbnail image below for a sample of a few pages from the report.

See today’s full post-market Closer and everything else Bespoke publishes by starting a 14-day trial to Bespoke Institutional today!
Apr 11, 2022
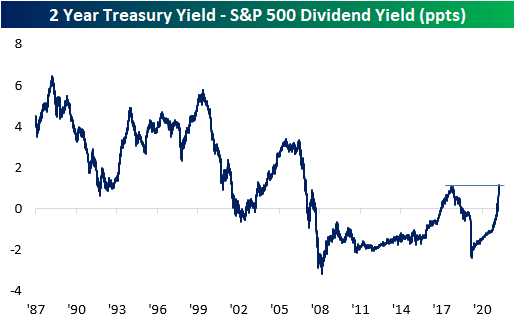
Since mid to late-2019 when interest rates really started to fall, the dividend yield on the S&P 500 consistently provided a higher yield than the two-year US Treasury. With a higher payout plus the potential for price appreciation, equities looked more attractive to many investors. The period from the Financial Crisis through 2017 also saw a similar setup where the S&P 500’s dividend yield was higher than the yield on the 2-year, but before the Financial Crisis and the FOMC’s zero-interest-rate policy, it was extremely uncommon for the S&P 500 to yield more than the two-year Treasury. This year has caused a tidal shift in the balance of power in yield between the S&P 500 and the two-year Treasury. As the Fed came to the conclusion that inflation wasn’t as transitory as originally thought and found itself behind the inflation curve, it shifted from a much more accommodative stance to one that was more biased towards tightening, and that shift resulted in one of the most rapid increases in two-year Treasury yields in decades. In the process of this spike in rates, back in February, the yield on the two-year rose back above the dividend yield of the S&P 500 for the first time since 2019.

As Treasury yields have continued to spike, the premium in yield of two-year Treasuries relative to the dividend yield of the S&P 500 reached an important milestone last Friday (4/8). As shown in the chart below, the spread between their yields widened out to 110 basis points (bps), taking out the high of 108 bps from 2018. At these levels, the spread between the two is now the widest it has been in fourteen years since the Financial Crisis. It started with long-term Treasury yields, but as the overall trend in rates has been higher, most of the Treasury yield curve is now yielding more than the S&P 500. For years now, investors have had a TINA (There Is No Alternative) relationship with the stock market, but as interest rates have shot higher, TINA is taking a backseat to BABY (Bonds Are Better Yielders). Click here to try out Bespoke’s premium research service.