May 24, 2022
In addition to weaker than expected preliminary S&P Global (formerly Markit) PMIs, another weak regional Fed manufacturing index hit the tape this morning. The Richmond Fed’s Manufacturing Composite dropped into contraction in May as the index hit its lowest level in two years. The 23-point month-over-month drop was also the second-largest decline on record behind the 49-point drop in April 2020.

Each regional Fed’s headline manufacturing number differs slightly in composition and the Richmond reading is made using shipments, new orders, and employment as inputs. As shown below, each of those indices experienced historic declines this month causing the massive drop in the composite. Breadth elsewhere in the report was not much better though. Other categories like capacity utilization, order backlogs, and average workweek also pulled back sharply. Meanwhile, expectations for several categories are in the bottom few percentile of their historical ranges going back to the start of the data in the 1990s. Overall, this month’s report showed a massive slowdown in activity that is consistent with other surveys that have come out this month.

Two of the inputs to the composite that also fell into contraction this month were new orders and shipments. New Orders have seen a small handful of larger declines with September of last year being the most recent one. New Orders were also much lower after that decline last fall. As for Shipments, the 31-point month-over-month decline ranks as the second-largest on record next to April 2020 when the index fell a whopping 77 points. While it does not necessarily outweigh the rapid deterioration in demand, one silver lining of the report was a further huge improvement in supply chains. The reading on Vendor Lead Times was sliced in half as the index remains below pre-pandemic levels.

Again, Employment is the third input to the composite and it was the sole input to remain in expansion in May. That being said, it too fell sharply versus the prior month. While that reading indicates lower mid-Atlantic manufacturers are currently net taking on more workers, expectations saw a record decline meaning hiring plans are likely to decelerate significantly in the near future. That is as wage growth has stalled out and the length of the average workweek has been cut.

Finally, in spite of supply chain improvements and weaker demand, prices have continued to rise unabated. Prices paid hit fresh record highs across both current conditions and expectations. Prices received are off-peak but the reading did tick up slightly in May. Click here to learn more about Bespoke’s premium stock market research service.

May 19, 2022
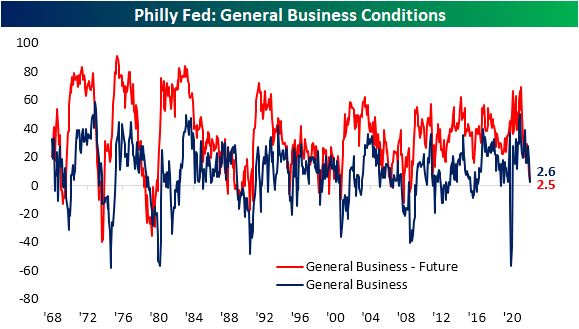
On the backs of a disappointing Empire Fed earlier this week, the neighboring Philadelphia Federal Reserve Bank’s own reading on its region’s manufacturing economy also came in well below expectations at the headline level. The index for General Business Conditions was anticipated to decline from a healthy reading of 17 to a more modest 15. Instead, it plummeted to a barely positive reading of 2.6. That would point to a significant moderation in activity in the month of May.
While the headline index fell sharply, the rest of the report was perhaps more mixed. Breadth was certainly weak with only three categories rising month over month (New Orders, Shipments, and Unfilled Orders). As for the indices that declined, on the one hand, some could be perceived as welcome drops with pullbacks in elevated readings of prices and delivery times. On the other hand, the moderation in Number of Employees or CapEx expectations could be taken as a less positive sign for the broader economy.

As shown in the table above, overall most current conditions indices remain historically elevated even after recent declines. Expectations indices meanwhile are generally more depressed with some readings even near record lows. As such, the average normalized distance between the current conditions and expectations categories throughout the report have broken out to the highest level since February 1988 and mid-1975 before that. Put differently, there have rarely been times in which the region’s manufacturers have reported such a dramatic difference between healthy current conditions while also holding a pessimistic outlook.

Taking a closer look at individual categories, New Orders remain well off-peak but ticked higher in May rising 4.3 points to 22.1. There was an even larger jump in expectations, although the level of that index is not nearly as elevated. The modest increase in demand was met with a huge jump in Shipments and Unfilled Orders. With a 16.2 point jump month over month, Shipments are reported to be growing at the fastest rate since the fall of 2020. Given the region’s firms are getting orders out the door at a faster clip, inventories are growing only modestly with that index falling to a barely expansionary 3.2. Additionally, that evidence of improved fulfillment also resulted in a huge drop in expectations for Unfilled Orders. In fact, that index dropped to the lowest level since March 1995. That means the region’s firms expect to work off unfilled orders at a historic rate in the coming months.

The likely reason as to why companies are anticipating such a huge improvement in fulfillment is massive expected declines in lead times. Delivery Times remain elevated but have moderated significantly in the past couple of months. Six-month expectations meanwhile have fallen all the way down to -29.1 which, like unfilled orders expectations, is the lowest level since March 1995.

Another expectations reading that has fallen precipitously in May is CapEx expectations. The reading fell to the worst reading since September 2016 indicating huge moderation in planned investment. Likewise, hiring is expected to slow as has already been observed by the current conditions index. We would note that these readings remain positive, meaning firms are still expecting to take on more hiring and spending on net, but at a more modest rate. Click here to learn more about Bespoke’s premium stock market research service.

May 5, 2022
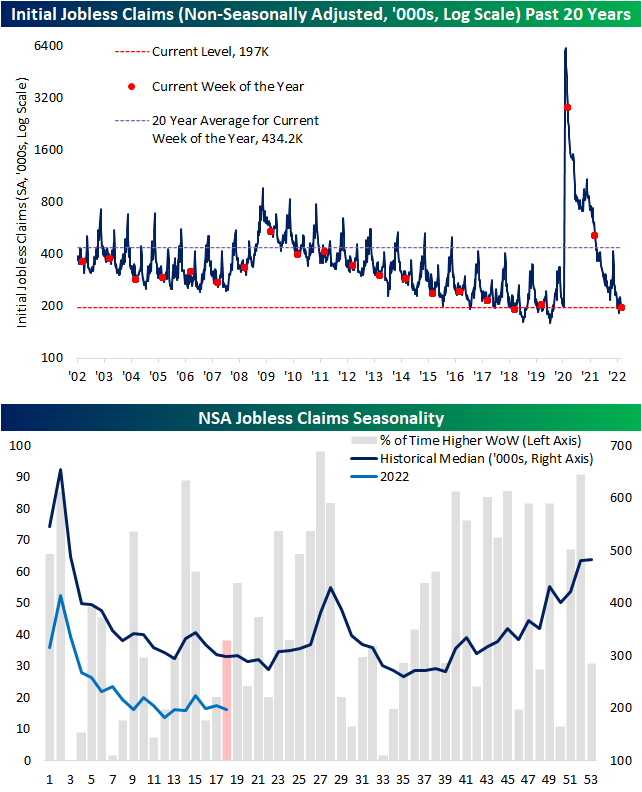
Initial jobless claims have come off of multi-decade lows in the past few weeks with the most recent print released this morning marking the most significant increase in some time. Claims are back up to 200K for the first time since the week of February 11th. Additionally, the 19K week over week increase was the largest one-week uptick since last July when they rose 33K and the level of claims was more than double what it is now.

Non-seasonally adjusted claims are also still at historically strong levels albeit having come off the lows. The only comparable week of the year that has seen a lower reading on claims was in 2018 when they were roughly 7K below current levels.
In terms of seasonal trends, claims will likely continue to fall modestly in the coming weeks before running into some seasonal headwinds in the late spring and early summer.
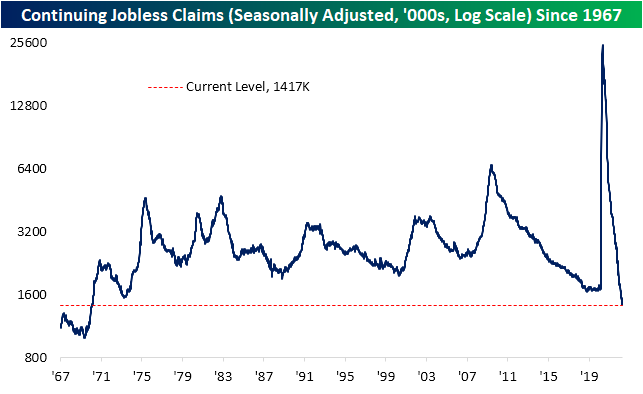
Continuing claims are delayed an additional week to initial jobless claims and this reading set a new low in the most recent print. Claims fell below 1.4 million for the first time since February 1970 reiterating the point that there are a historically small number of people filing continued unemployment claims. Click here to learn more about Bespoke’s premium stock market research service.

Apr 21, 2022
Seasonally adjusted initial jobless claims remain off of the low from one month ago, but this week did see a sequential improvement. Claims dropped by 2K to 184K from last week’s slightly upwardly revised level of 186K. That is the ninth week in a row with sub-200K prints as claims sit at some of the lowest levels on record.

Before seasonal adjustment, claims were also impressive falling from 224.1K to 196.9K as the brief seasonal uptick at this point of the year unwinds. As shown in the second chart below, the current week of the year has only seen claims rise week over week 12% of the time historically. Claims will likely continue to see seasonal tailwinds through the next several weeks before a seasonal increase in the late spring and summer.

Lagged one week to initial claims, continuing claims came in below expectations of 1.459 million, reaching a new low of 1.417 million. That sets the lowest level since February 1970. Click here to view Bespoke’s premium membership options.