The Overbought Buck
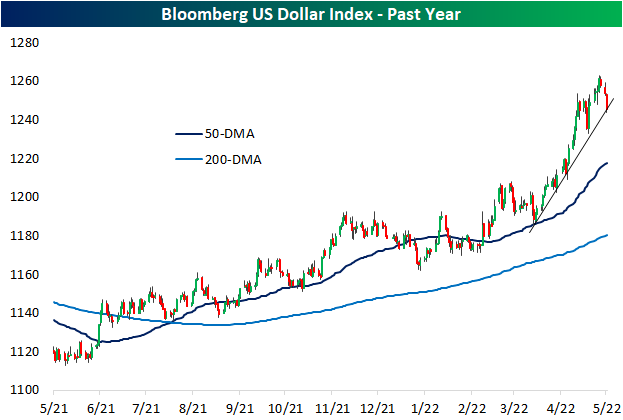
The US dollar has surged amidst the weakness in risk assets in 2022. While also part of a longer-term and more gradual uptrend over the past year, in the past couple of months the Bloomberg Dollar Index has seen its uptrend steepen significantly. Since the last retest of its 50-DMA at the end of March, the dollar was up over 6% through the closing high last Thursday. To round out last week and start this week, the dollar has pulled back sharply with a 1.25% decline. While that may not sound like much, it ranks in the third percentile of all 3-day moves going back to the start of the index in 2005.
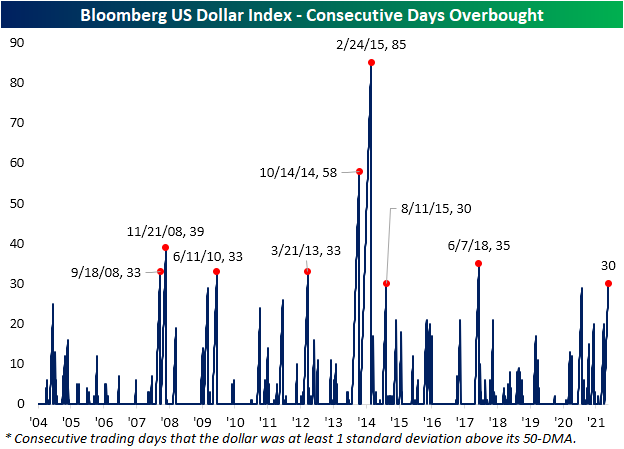
At the moment, the dollar is testing the aforementioned steep uptrend off the late March low. Assuming that the uptrend or any recent lows do not provide support, the dollar has much further to go until it would test its 50-DMA. In fact, the dollar would currently need to fall another 2.28% to reach its 50-DMA as it has consistently traded well above that moving average for multiple weeks in a row. As shown in the second chart below, the dollar recently hit some of the most overbought levels of the past five years, and the long stretch of days with overbought (1+ standard deviation above its 50-DMA) readings has continued.

While recent declines have put the streak on the ropes, today marks the 30th consecutive trading day that the dollar has been at least one standard deviation above its 50-DMA. Going back through the history of the index, there have only been 8 other streaks that have also gone on for at least 30 trading days. The most extended of these ended in February 2015 at 85 days long. The next longest only occurred shortly before that in October 2014.
Additionally, given the dollar has been pulling back, it could be reasoned that stocks with heavy domestic exposure would underperform relative to those with more international exposure. Since last Thursday, that has largely been the case. In the chart below, we have broken down the Russell 1,000 into deciles based on their share of revenues generated from abroad. The first decile is composed entirely of stocks with 100% of revenues generated within the US while the tenth decile is the stocks with the most international exposure. That tenth decile has seen notable outperformance with an average gain of nearly 6% versus an average of 4.2% for all other deciles. The eighth and ninth deciles have also averaged stronger returns than most other groups while the worst performance comes from the first decile, the 100% domestic stocks. Click here to learn more about Bespoke’s premium stock market research service.
