Bespoke’s Best Charts of the Week
After another busy week for the markets, we wanted to highlight some of our favorite charts that we published for paying subscribers. Enjoy! Click here to start a two-week trial to Bespoke Premium and receive our paid content in real time.
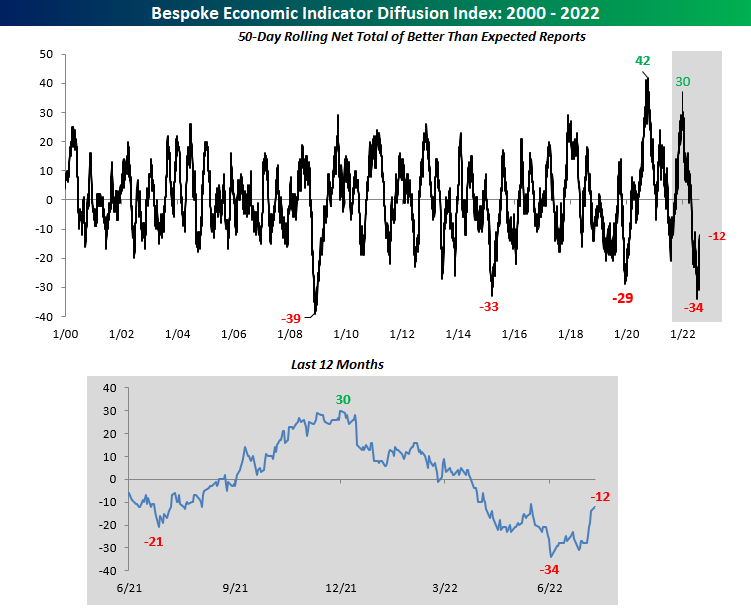
We started off the week by looking at our economic indicator diffusion index, which measures the pace at which economic indicators are coming in ahead (or below) consensus economist estimates over a 50-day period. In late June, this index hit a low that had not been seen since the great financial crisis, but it’s now 22 points above this level. It seems as if economists are struggling to predict economic data points, as the index has seen extremes in both directions since the onslaught of the pandemic.
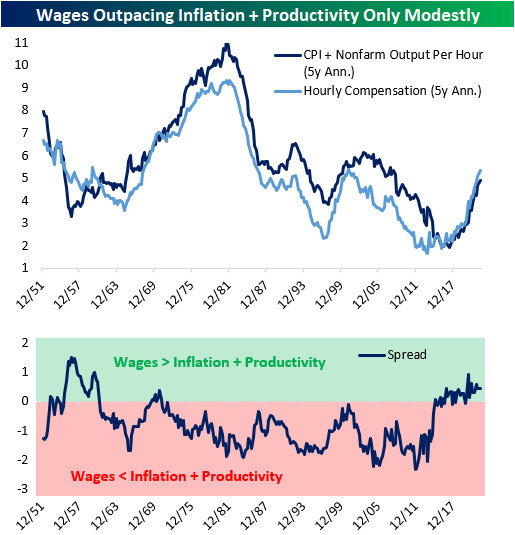
On Tuesday, we noted that, in the short-term, wages are rising far faster than output can justify, which means that either output needs to ramp up or wages need to decelerate. Over the long-term, though, nominal wages are basically moving at a similar pace to consumer prices plus productivity. In other words, on a trend basis, workers are earning slightly more than inflation plus productivity over the past five years. This tells us that the wage growth experienced over the last five years is likely sustainable, and further wage growth over the medium-term would not be surprising.
Following Wednesday’s inflation print, we took a look at the S&P 500’s performance when CPI is decelerating versus accelerating. As you can see from the chart below, decelerating inflation leads to better market performance across the board.

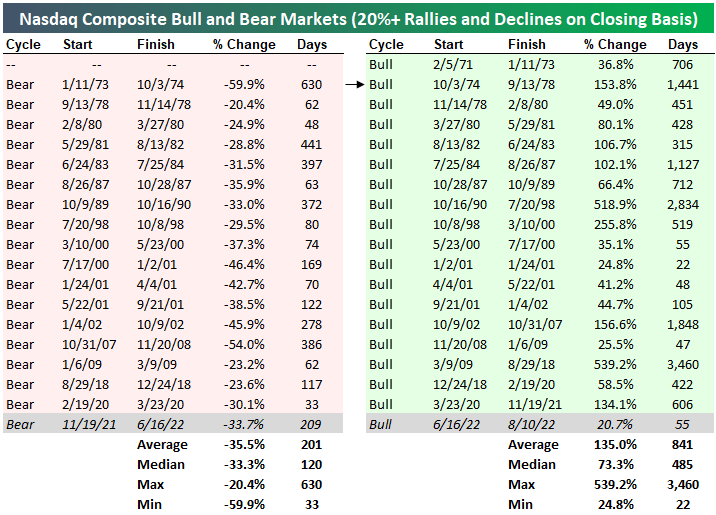
As of Wednesday, the Nasdaq Composite officially entered a new bull market based on the traditional 20%+ rally/decline threshold. All-in-all, the bear market experienced between November 19th, 2021 and June 16th was extraordinarily average, with the duration being just eight days above the average and the drawdown being 1.4 percentage points below that of the average. Let’s hope that this bull market is average as well, as this would imply gains of 135% over 841 days relative to the 6/16 low.
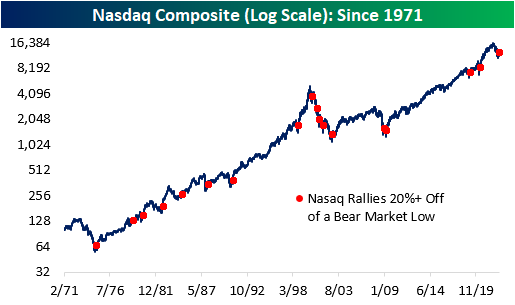
Below are all of the 20%+ rallies off of bear market lows since the Nasdaq’s inception. Apart from the dot-com era which experienced a massive bust, the forward performance has been quite positive.
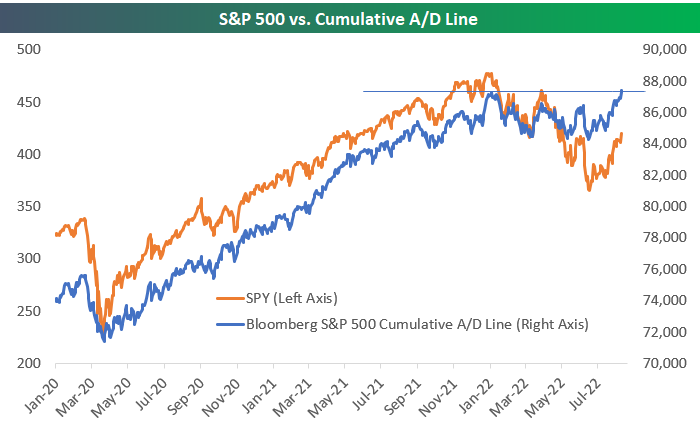
As of Thursday’s close, Bloomberg’s tracking of the S&P 500’s cumulative advance/decline line made a new all-time high. That represents significant divergence from the index’s price, which is still 12% below all-time highs. This kind of divergence is typically viewed as bullish, but you can read our B.I.G. Tips report on the topic to see if that’s really the case based on historical trends.
Americans across the country are breathing a sigh of relief as the AAA National Average price of gas per barrel broke below $4.00. Although the level is still elevated, the price of gas has been continuously declining.

This week was equally busy in the political sphere. Donald Trump’s residence was raided by the FBI, Biden signed the CHIPS Act, and the Inflation Reduction Act appears likely to be signed into law. All of this has come as we’ve seen a big shift in the betting market odds for Democrats and Republicans to take control of the Senate later this year.

If you would like to receive content like this daily, click here to start your trial today!